

Singapore Tops 2025 Global Crypto Rankings as RWA Tokenization Jumps 63%: Report
Singapore has taken the top position in Bybit’s World Crypto Rankings 2025, strengthening its status as one of the most active and structured digital-asset markets.
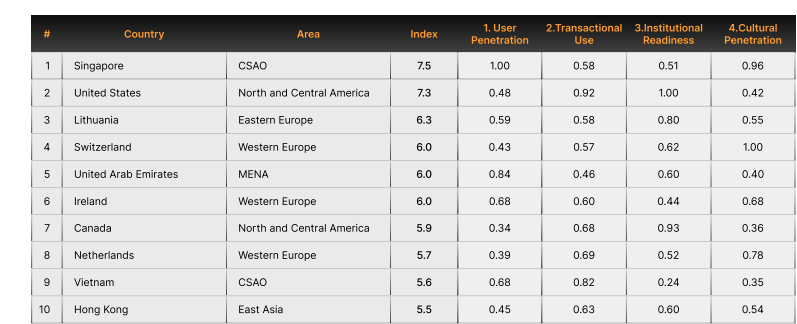
The new index, produced in conjunction with DL Research, evaluates countries across user activity, institutional readiness, and cultural engagement.
It positions Singapore ahead of the United States and Lithuania, two countries that continue to shape the direction of global crypto markets in distinct ways.
Report Reveals Two Distinct Global Crypto Adoption Models
The report shows how Singapore reached a score of 7.5 out of 10, driven by high user penetration and strong cultural engagement around digital assets.
Its licensing regime, high digital literacy, and active institutional sector have helped create one of the strongest pipelines between retail users and regulated financial entities.
The United States follows closely with a score of 7.3. Its ranking is supported by trading volumes, custody activity, and a growing base of tokenization projects involving major banks and asset managers.
 Source: Bybit report
Lithuania, which secured third place with a score of 6.3, continues to be a preferred regulatory base for fintech and exchange firms.
The top ten also includes Switzerland, the United Arab Emirates, Ireland, Canada, the Netherlands, Vietnam, and Hong Kong.
The data shows two clear adoption models. Countries such as Singapore, the U.S., Switzerland, Lithuania, and the UAE reflect an institution-driven pattern shaped by regulation and financial infrastructure.
 Source: Bybit report
In contrast, Vietnam, Nigeria, Ukraine, and the Philippines rely on crypto for everyday functions such as remittances, payments, and savings during currency pressure or banking restrictions.
This pattern is consistent with earlier studies from Chainalysis and TRM Labs, which also found high adoption in markets facing economic constraints.
Ukraine, Moldova, and Georgia continue to lead when measured against population size.
Global RWA Market Climbs 63% as Institutions Accelerate Adoption
The report also highlights how quickly real-world asset tokenization has expanded. The market for tokenized RWAs, excluding stablecoins, has risen more than 63% since January 2024, reaching $25.7 billion in early 2025.
Source: Bybit report
Notably, private credit and U.S. Treasuries dominate the sector, holding 15.6 billion and 6.7 billion dollars, respectively.
The United States maintains the strongest institutional readiness with a perfect score, supported by regulatory clarity and deep Wall Street engagement.
BlackRock’s BUIDL fund remains one of the fastest-expanding tokenized portfolios, reaching between 1.8 billion and 2.28 billion dollars across several blockchains.
Major banks like JPMorgan, Citi, and Goldman Sachs have expanded tokenized settlement and internal trading programs.
Source: Bybit report
Canada now ranks second in institutional readiness with a score of 0.93, supported by new rules for banks and insurers that will take effect in 2026.
The Philippines is also gaining momentum, becoming a regional example for Southeast Asia as it sets guidelines designed for remittance-heavy markets.
Global Data Shows Surging Stablecoin Use as Singapore Leads Tokenization Push
Singapore’s broader role in tokenized finance has grown as well. In November, the Monetary Authority of Singapore confirmed plans to pilot tokenized MAS bills settled using a central bank digital currency.
Local banks have already tested interbank lending using a wholesale CBDC, reinforcing the shift from experimentation to real operational use.
MAS officials say asset-backed tokens have clearly moved beyond the laboratory stage.
The report also pointed out that stablecoins remain the most consistent asset type across all income groups.
Ukraine records the highest stablecoin flow relative to GDP at 3.6%, followed by Nigeria, Georgia, Vietnam, and Armenia.
Source: Bybit report
These flows underline how digital dollars have become a financial tool in both developed and emerging regions.
Separate research in March showed strong momentum in the Gulf region. The UAE recorded a 210% surge in adoption, the highest of any country in 2025, supported by high ownership levels and strong search activity.
Singapore and the United States followed, with adoption growth of 150% and 220%, respectively.


You May Also Like

Arbitrum Announces Ten Innovative Teams — And Why It’s Not Just Hype
Cango Inc. Completes $65M Investment and Secures $10M Convertible Note Financing

Cathie Wood’s ARK Invest Buys $13.7M in Circle Shares While Selling Robinhood Stock


