

Solana price risks a crash to $100 despite key Breakpoint news
Solana price remained in a tight range this week despite delivering some notable news from the ongoing Breakpoint event.
- Solana price has formed a bearish flag pattern on the daily chart.
- The network made some major announcements at the Breakpoint event.
- The spot Solana ETFs have continued adding assets this week.
The Solana (SOL) token was trading at $131 today, Dec. 11, down by nearly 50% from its highest level in September this year, and technical indicators suggest further downside, potentially to $100.
Solana’s price remained sideways despite notable ecosystem news. One of the most recent news was the bridge between Solana and Base through the Chainlink (LINK) network. This was a significant event, as the two are among the leading chains in the crypto industry, with Base hosting over 700 dApps and a TVL of over $8.3 billion.
The other notable Solana news came from Ondo Finance and State Street, which will launch SWEEP, a new private tokenized liquidity fund bringing traditional cash management onchain.
Similarly, Animoca Brands, a top player in the crypto industry, announced that it would launch its equity on Solana. Bhutan will also launch the first sovereign-backed gold token on the network.
Another major Solana development came from Coinbase, which launched a product that allows users to trade all Solana tokens on a decentralized exchange. This is notable as it exposes Solana and its ecosystem to millions of users.
Meanwhile, Solana’s ETFs have continued gaining assets since their launch in October. They have recorded inflows totaling more than $22 million this week, exceeding last week’s $20 million. This growth has resulted in cumulative net inflows of $661 million and net assets of $950 million.
Solana price technical analysis
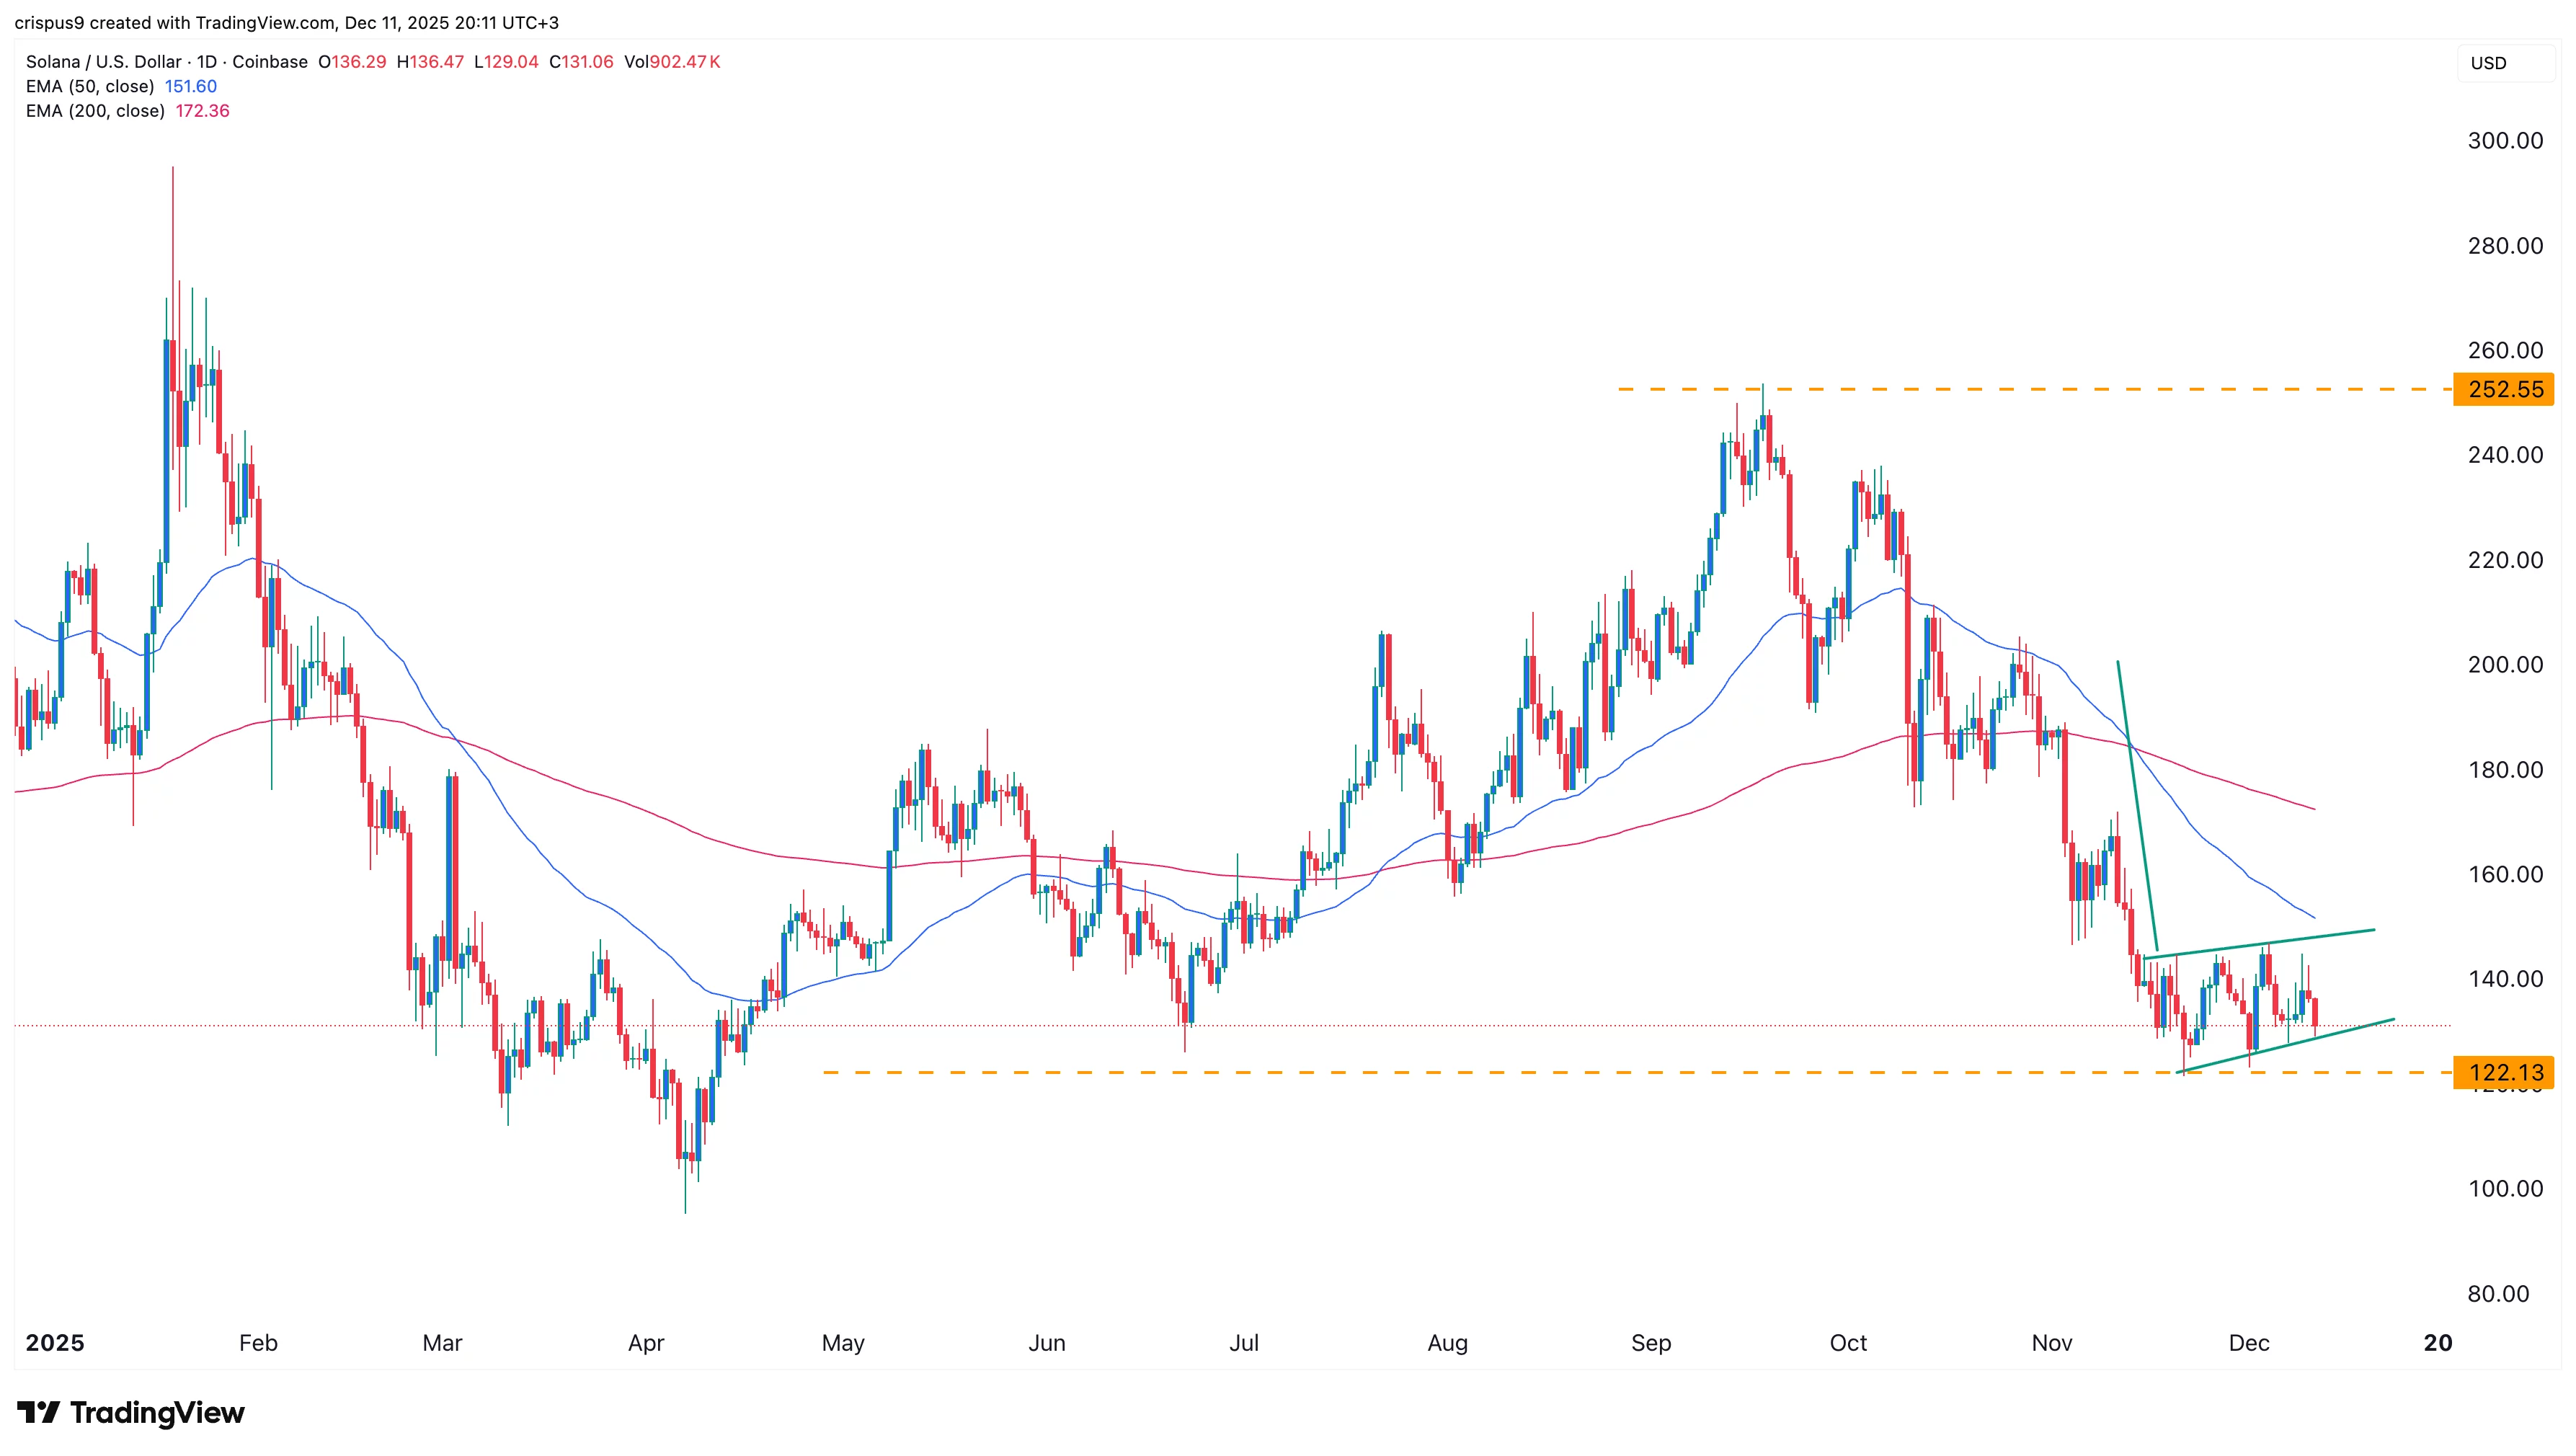
The daily timeframe chart shows that the SOL price has been in a strong downward trend in the past few months, moving from a high of $252 in September to the current $130.
Solana has formed a bearish flag pattern. It has already completed forming the flagpole and is now forming the flag section.
The token has formed a death cross pattern as the 50-day and 200-day Exponential Moving Averages have crossed each other.
Therefore, the token will likely have a strong bearish breakout, potentially to the psychological level at $100. This view will be confirmed if it moves below the key support level at $122, its lowest level on Nov. 21 and Dec. 1.
The bearish Solana price forecast will become invalid if it moves above the upper side of the flag pattern at $147.
You May Also Like

Impact of Iran war on Filipinos: What happens now?

How to earn from cloud mining: IeByte’s upgraded auto-cloud mining platform unlocks genuine passive earnings


