Chainlink Price Under Pressure as Bears Defend Key Resistance Levels
TLDR
- Chainlink price remains below the descending trendline, with $16–$17 acting as key resistance.
- The $12–$13 demand zone is holding, limiting downside risk in the short term.
- LINK-related ETFs show steady inflows, signaling consistent institutional demand.
- Whale wallets have accumulated over 20M LINK, supporting a constructive long-term bias.
Chainlink price remains constrained below key technical resistance as short-term structure reflects ongoing seller control. While daily charts show continued weakness, growing ETF inflows and whale accumulation suggest improving longer-term fundamentals. The market is now weighing near-term downside risks against emerging demand signals that could influence a broader recovery toward the $18–$20 zone.
Chainlink Price Struggles Below Descending Trendline
Analyst CRYPTOWZRD showed on the daily chart a bearish technical structure defined by a series of lower highs. A descending trendline from the September peak remains intact, capping upside attempts and reinforcing seller dominance near the $16–$17 resistance area. The latest daily close below this zone confirms that prior breakdown levels are still being defended, keeping price action compressed within a corrective range.
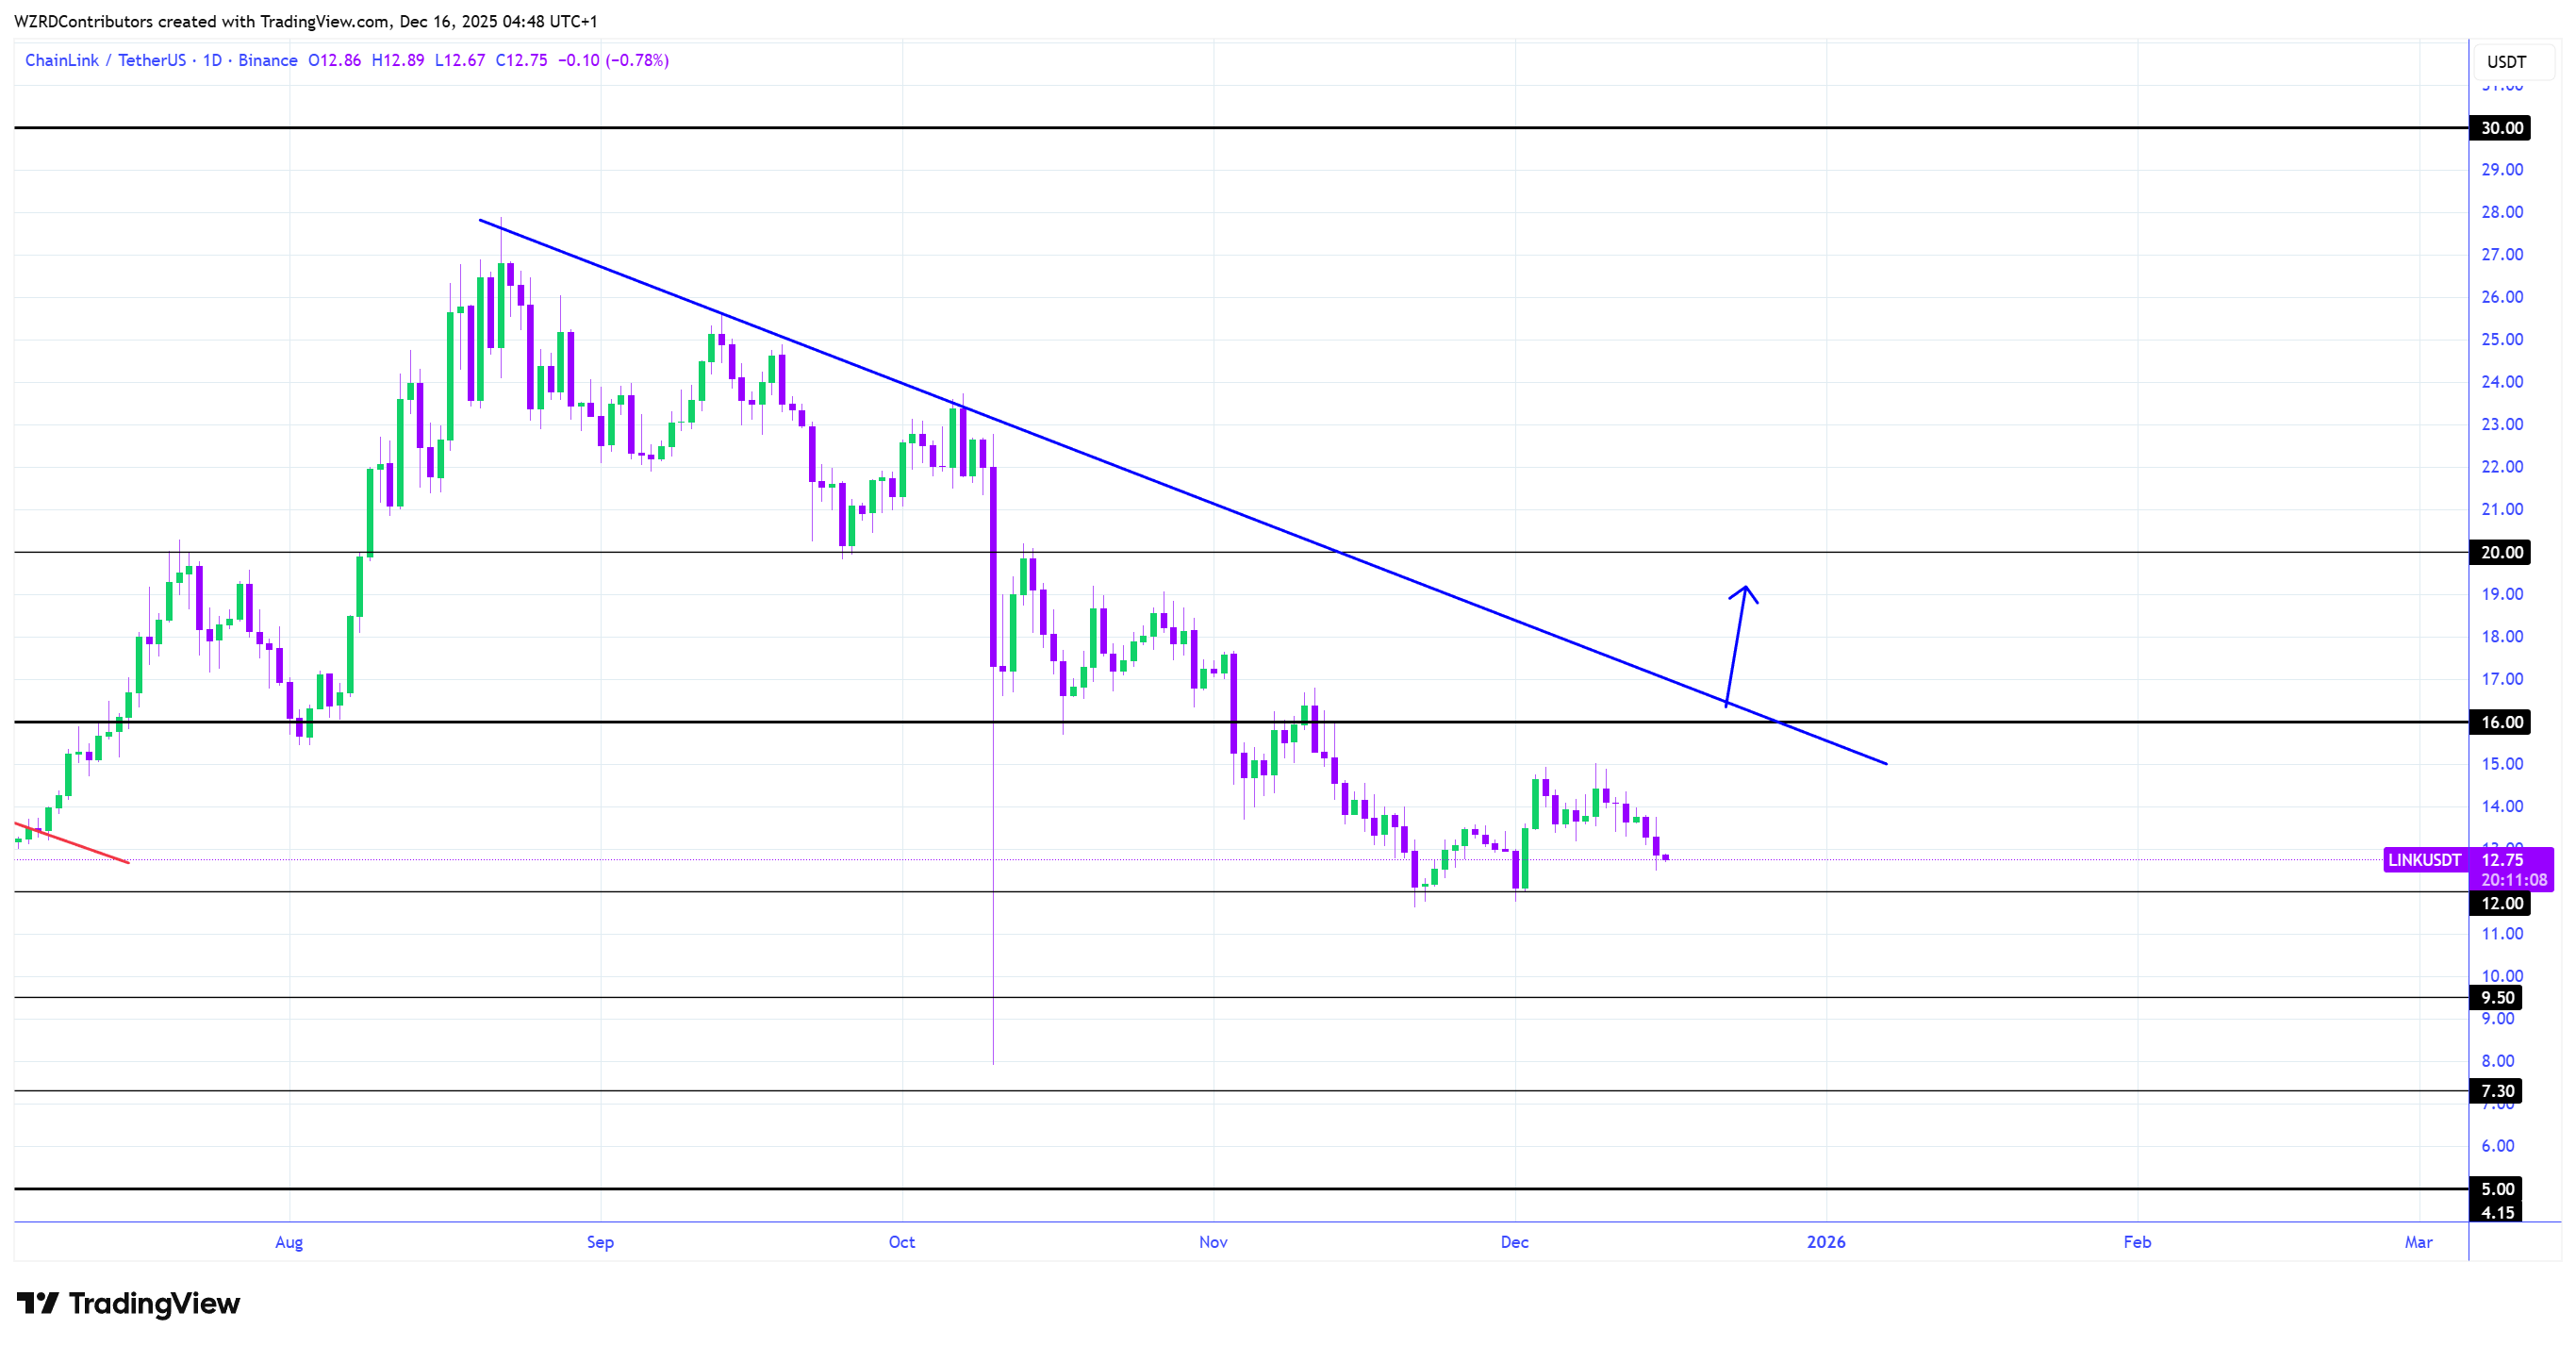
Despite this pressure, LINK is holding above the $12–$13 demand zone, which has provided short-term stability throughout December. This zone represents a critical inflection point, as a breakdown would expose the market to a deeper retracement toward $10. For now, consolidation near support suggests selling momentum is easing. Analysts noted that a broader market catalyst, particularly from Bitcoin, may be required to trigger a decisive directional move.
ETF Inflows Signal Persistent Institutional Demand
On the other hand, data shared by Altcoin Buzz points to a constructive backdrop driven by sustained ETF inflows. Since LINK-related ETF activity began, there have been no recorded days of net outflows. As of December 15, cumulative inflows stood near $54.69 million, following a $2.02 million daily addition. This uninterrupted sequence highlights steady institutional participation.
SOURCE: X
Early December inflows were especially notable, including a single-day addition of $37.05 million on December 2. Subsequent contributions reinforced accumulation, even as some sessions recorded flat flows instead of withdrawals. Market investors view this pattern as indicative of stability, with regulated investment vehicles absorbing supply. Such behavior typically reflects longer-term positioning rather than short-term trading activity.
Whale Accumulation Supports Long-Term Outlook
Additionally, on-chain data from Santiment reveals a shift in behavior among Chainlink’s largest holders. Since early November, the top 100 wallets have accumulated approximately 20.46 million LINK, valued at $263 million at the time of measurement. This marks a clear reversal from earlier distribution, with whale balances rising even as price trended lower.
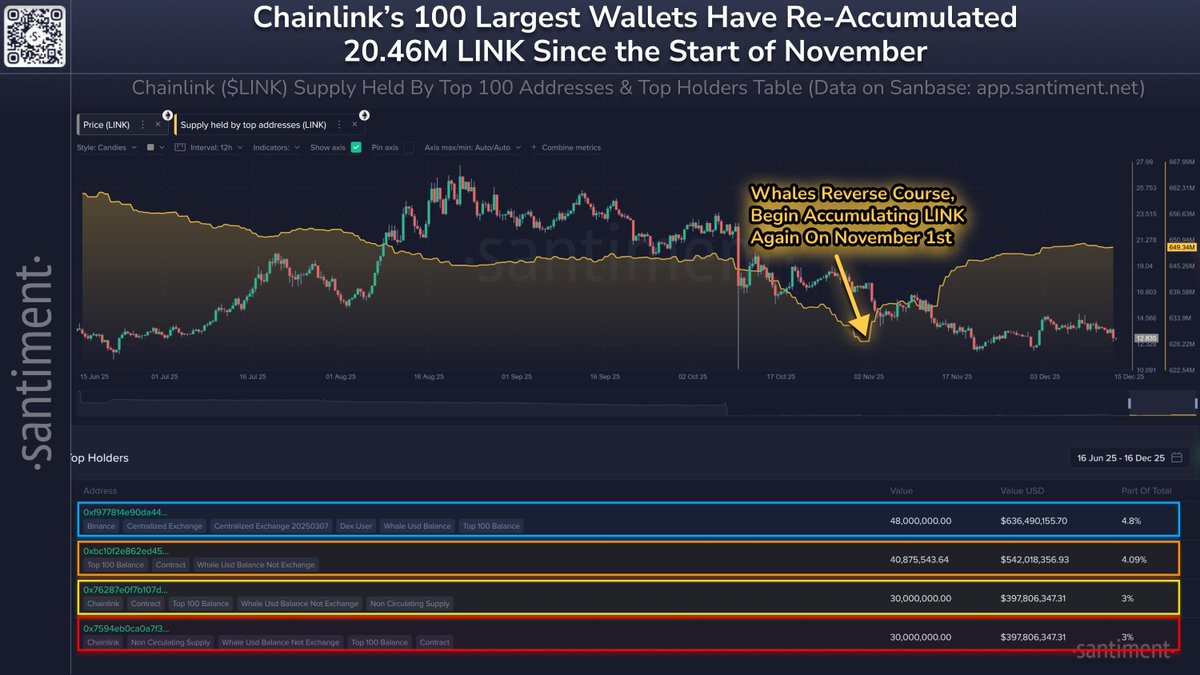
The divergence between declining price action and increasing whale holdings suggests strategic accumulation during weakness. Much of this supply is held in non-exchange wallets, including contracts and non-circulating addresses, reducing immediate sell-side pressure. Historically, such patterns have preceded medium-term trend improvements, particularly when paired with improving demand metrics.
Market Outlook Remains Data-Dependent
Taken together, technical structure and on-chain indicators present a mixed but evolving picture. Short-term charts continue to favor caution while price remains below the descending trendline and $16 resistance.
However, ETF inflows and whale accumulation provide a supportive backdrop that could influence future price discovery if momentum shifts.
As markets await confirmation from broader crypto conditions, the $12–$13 support zone remains pivotal. A sustained break above trend resistance would signal improving momentum, while failure to hold support could extend consolidation. For now, Chainlink sits at a technical crossroads, with institutional demand shaping the longer-term narrative.
The post Chainlink Price Under Pressure as Bears Defend Key Resistance Levels appeared first on CoinCentral.


You May Also Like

Silver Price Forecast: XAG/USD holds losses near $80.50 due to renewed inflation concerns

Pulsz Social Casino Expands Gaming Portfolio in 2026