

Solana (SOL) Price: Token Drops 5% After Pump-and-Dump Wipes Out $250 Million in Liquidations
TLDR
- Solana’s price dropped nearly 5% in 24 hours after a pump-and-dump during the New York trading session that wiped out $250 million in long positions
- The token broke below a key $128 support level and is currently trading around $122, with technical indicators suggesting possible decline to $100
- Weekly transactions on the Solana blockchain have fallen from 816 million in July to 527 million, showing reduced network usage
- Open interest in Solana futures has dropped to half of its October 10 levels, falling from $14.8 billion to around $7.4 billion
- Price faces immediate resistance at $128 and could test the $120 support level, with RSI showing accelerating negative momentum
Solana experienced volatile trading during the New York session on December 17, resulting in a 9% price swing in just two hours. The token initially rallied to $134 before dropping sharply to $122.
 Solana (SOL) Price
The price currently sits at approximately $122, representing a nearly 5% decline over the past 24 hours. Trading volumes increased by 17% during this period.
The rapid price movement led to $250 million worth of long position liquidations over a four-hour span. The selling pressure intensified after SOL hit $134, triggering the sharp reversal.
Some of the price action may have been influenced by tech sector weakness. Companies including Oracle, Nvidia, and Broadcom posted losses after their earnings reports, weighing on risk assets.
Network Activity Shows Declining Usage
The Solana blockchain has seen a decrease in transaction activity since July. Weekly transactions peaked during the week ending July 17 at 816 million.
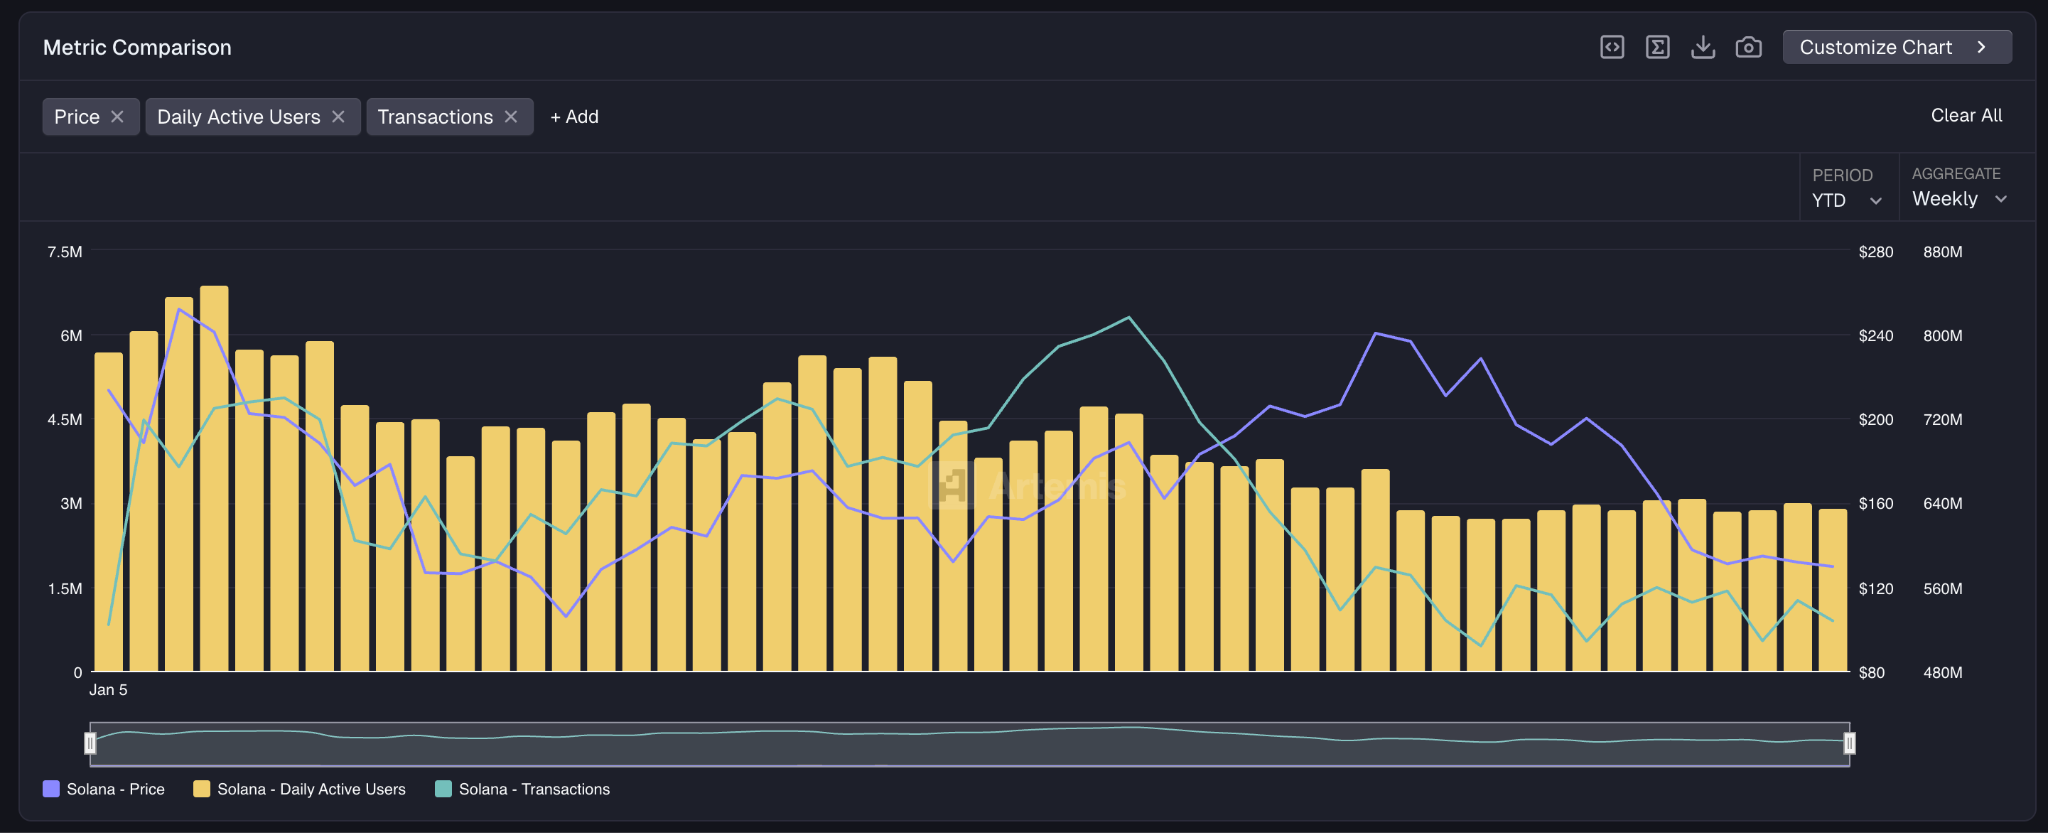 Source: Artemis
The most recent data shows weekly transactions dropped to 527 million. This represents a decline of about 35% from the July peak.
Lower activity in the meme coin sector has contributed to reduced demand on the network. Many tokens in this category have underperformed throughout the year.
Technical Breakdown Signals Further Downside
Solana broke below a key support level at $128 on December 17. The token had bounced from this level multiple times over the previous two months.
The Relative Strength Index dropped below its 14-day moving average, generating a sell signal. This indicates negative momentum is building.
The price faces immediate resistance at $125, with the next level at $128. A bearish trend line has formed with resistance at $131.
Support now sits at $121.50, which represents the last line of defense for bulls. If this level fails, the token could decline to the $120 zone.
Technical analysts suggest a potential move to $100 if selling pressure continues. This would represent an 18% drop from current levels.
Trader Sentiment Remains Weak
Open interest in Solana futures has fallen dramatically since October 10. The metric stood at $14.8 billion on that date but has since dropped to approximately half that amount.
The October 10 flash crash resulted in $16 billion worth of liquidated long positions. This event appears to have damaged trader confidence.
The Fear and Greed Index currently registers at 25, indicating fear in the market. Recent interest rate cuts have not improved sentiment.
Price action in lower timeframes shows limited buying at the $121.50 support level. The current trading range is between $120 and $128, with the 100-hourly simple moving average providing resistance.
The post Solana (SOL) Price: Token Drops 5% After Pump-and-Dump Wipes Out $250 Million in Liquidations appeared first on CoinCentral.


You May Also Like

SUI Big Problem: Why an All-Time High May Never Come Again

How to Spot a South African Cyber-Scam Before You Click “Pay”


