

Bears Maintain Control as Ethereum price Tests Key Support and Fear Builds

In a defensive crypto market, Ethereum price is trading around $2,960 against USDT while sentiment, liquidity, and risk appetite all point to a cautious environment.
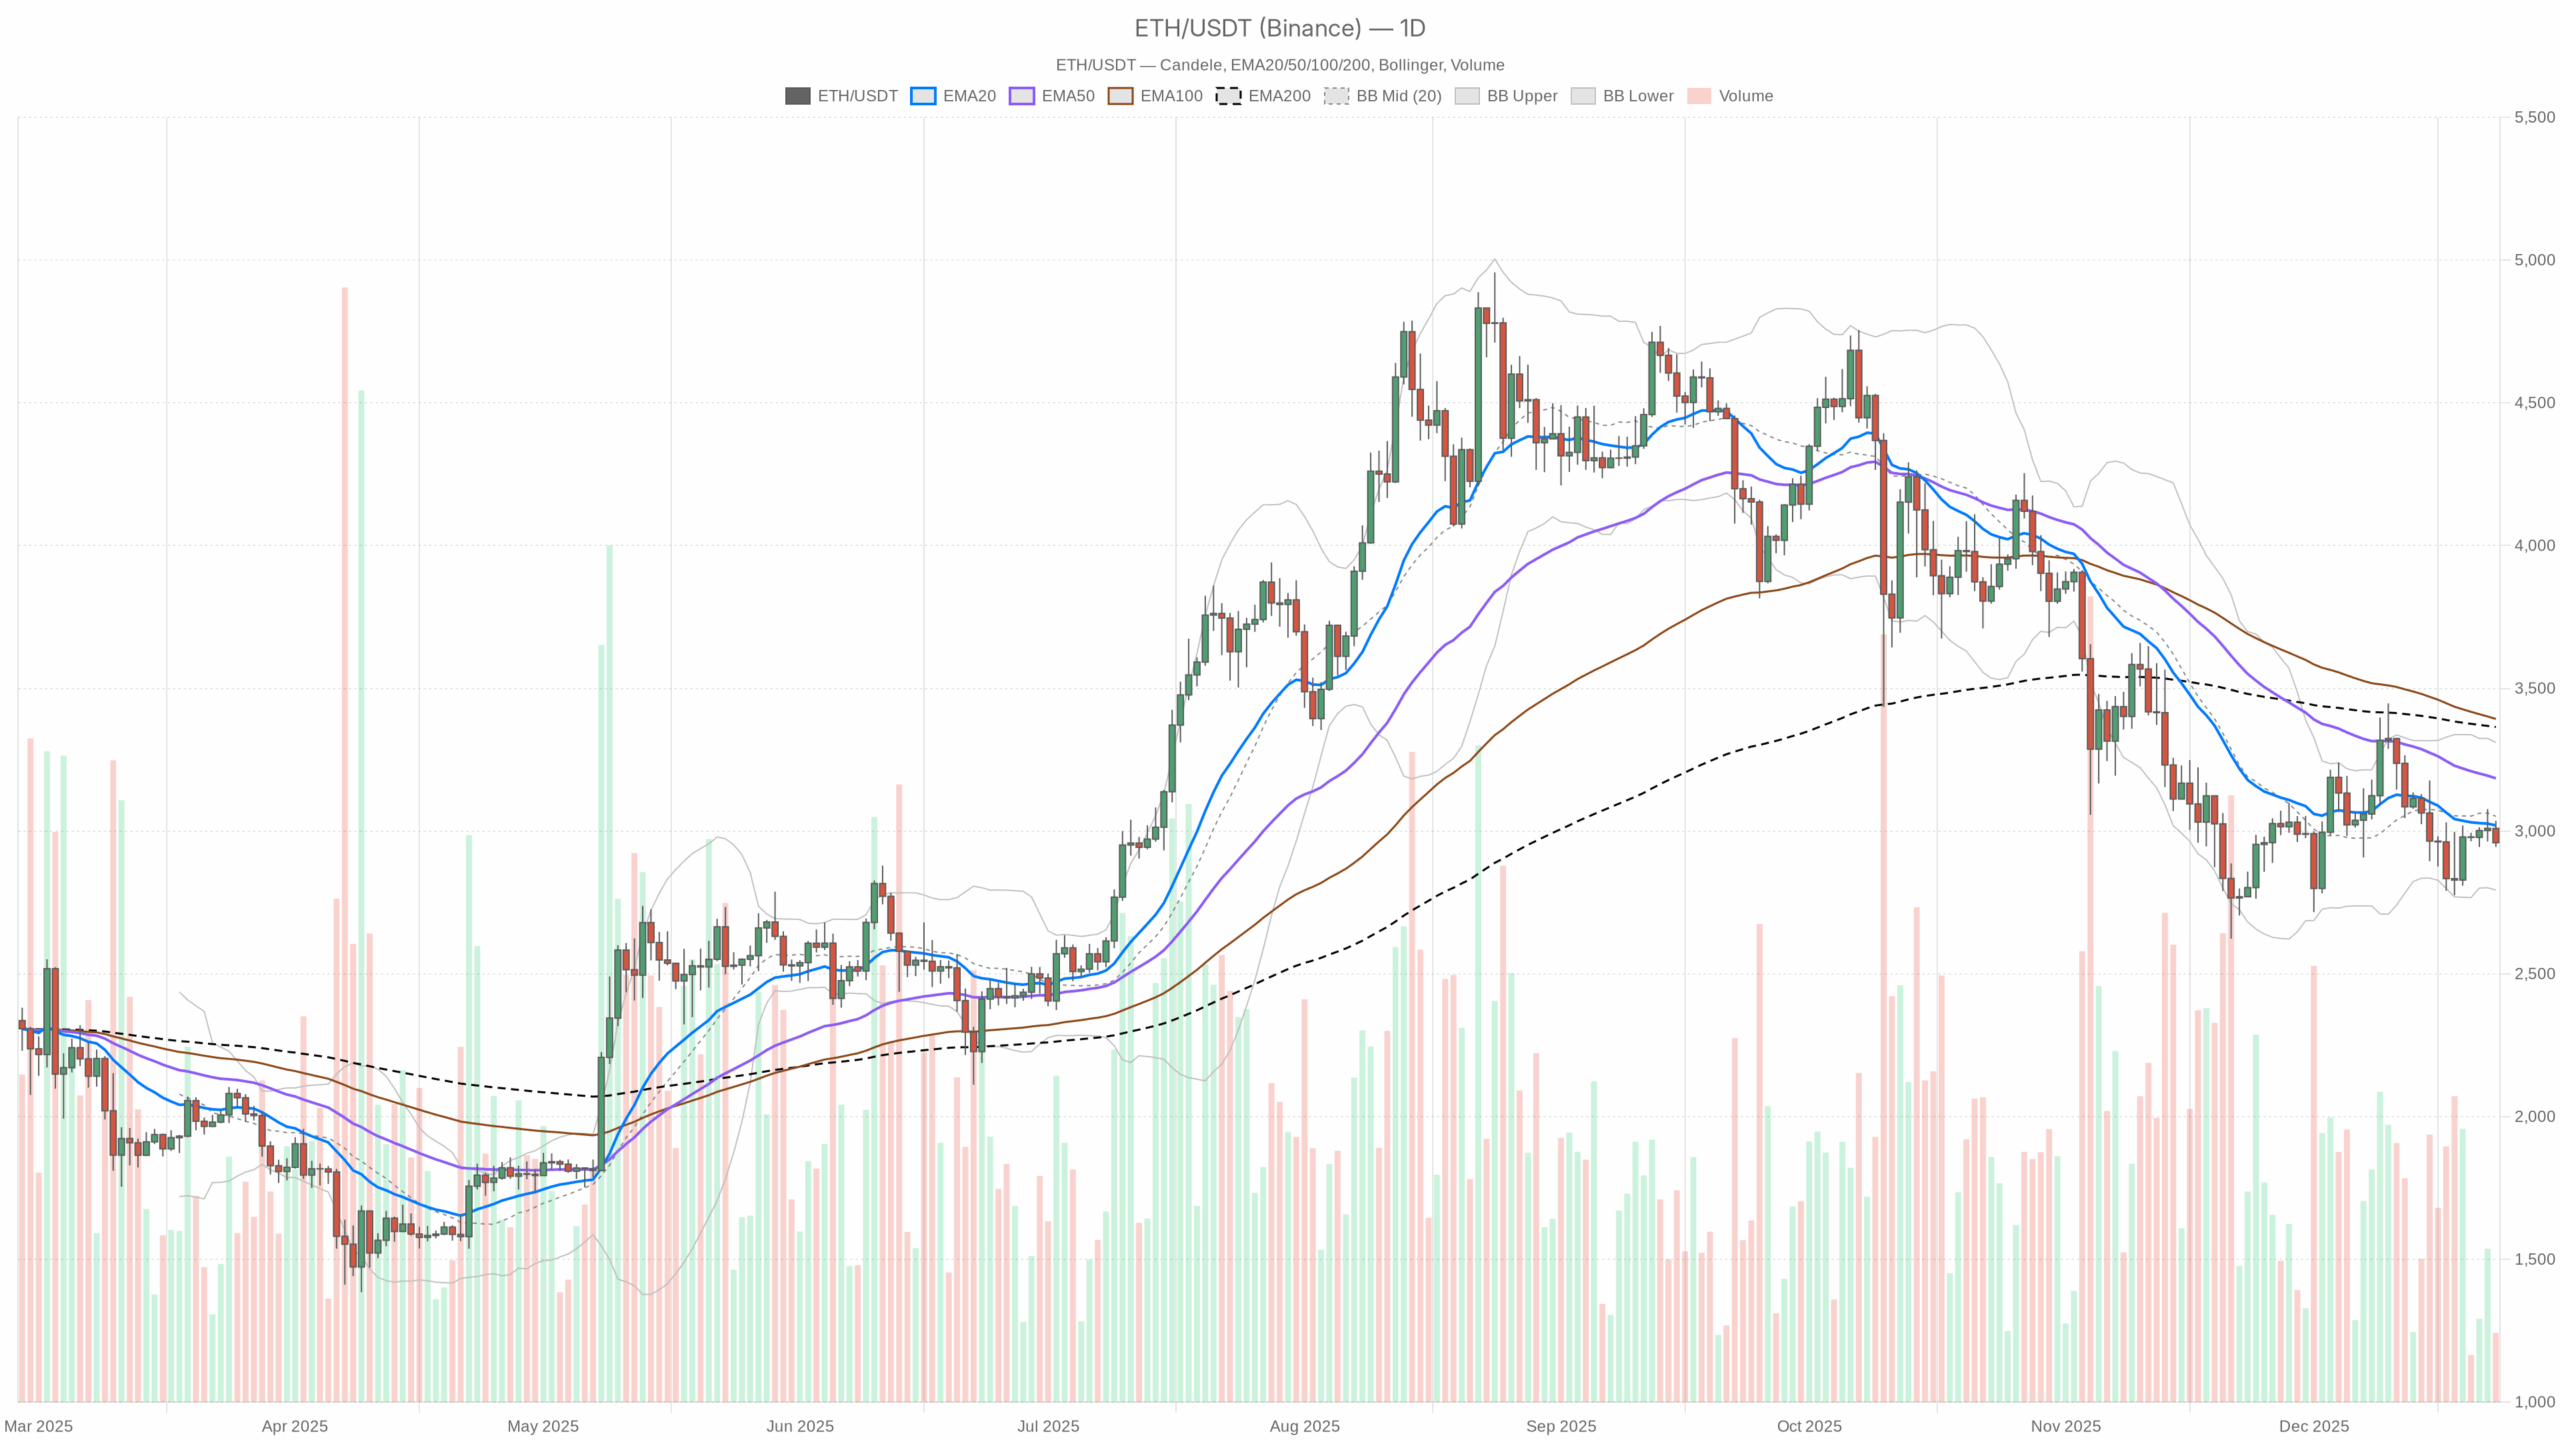 ETH/USDT — daily chart with candlesticks, EMA20/EMA50 and volume.
Daily Chart (D1) – Main Scenario about Ethereum price: Bearish, But Not a Crash Setup
The daily structure is clearly bearish, with Ethereum price closing below all major moving averages and under the midline of the Bollinger Bands. This points to a market in a downtrend / mean-reversion phase rather than a new impulsive bull leg.
Trend Structure: EMAs
- Price (close): $2,959.27
- EMA 20: $3,019.88
- EMA 50: $3,184.91
- EMA 200: $3,364.37
- Regime tag: bearish
Price is stacked below the 20, 50 and 200 EMAs, and those averages themselves are sloping down. That is classic downtrend behavior: rallies into the 20-day and 50-day are likely to be sold rather than chased. With the 20 EMA far under the 200 EMA, the market is not debating whether it is in a bull trend pullback; it is pricing in a broader corrective phase.
Momentum: RSI
- RSI (14): 44.8
Daily RSI below 50 but above 30 matches a controlled downtrend rather than panic. Sellers have the upper hand, but the market is not yet in a washed-out, capitulation zone. This leaves room for further downside before value hunters feel forced to step in.
Momentum & Trend Confirmation: MACD
- MACD line: -49.88
- Signal line: -51.16
- Histogram: +1.28
MACD is negative, confirming the broader bearish regime, but the line has crossed slightly above the signal, turning the histogram marginally positive. That is often how downtrends breathe: the strong leg lower pauses, shorts trim, and price mean-reverts upward before the next decision. It hints more at short-covering potential than at a clean bullish reversal.
Volatility & Range Context: Bollinger Bands and ATR
- BB midline: $3,051.85
- BB upper band: $3,310.42
- BB lower band: $2,793.29
- ATR (14): $149.33
Ethereum price is trading below the Bollinger midline and in the lower half of the band, consistent with a downtrend channel. However, it is not hugging the lower band, so momentum is more grind than waterfall. With a daily ATR around $150, the market can easily swing 5% in either direction in a single session. Traders should expect fast invalidations on tight stops and avoid assuming today’s price level is safe in either direction.
Key Daily Levels: Pivots
- Pivot point (PP): $2,979.95
- Resistance 1 (R1): $3,015.11
- Support 1 (S1): $2,924.11
The daily pivot sits just above spot, so Ethereum price is trading slightly below its intraday fair line. R1 at $3,015 roughly coincides with the 20-day EMA and Bollinger midline region. That turns the whole $3,000–3,050 zone into a first serious ceiling. On the downside, S1 around $2,924 is the immediate floor; a daily close below it would open the door to a test toward the lower Bollinger band near $2,800.
Bottom line on D1: the main scenario is bearish. Trend and structure favor sellers, while momentum shows only the early signs of a pause, not a reversal.
Hourly Chart (H1) – Pressure on Ethereum price is Still Down
The 1-hour chart confirms the daily bearish bias. There is no serious disagreement between timeframes; the lower timeframe is simply showing the intraday mechanics of the broader downtrend.
Trend and Structure: EMAs
- Price: $2,958.39
- EMA 20: $2,991.88
- EMA 50: $2,997.31
- EMA 200: $3,004.83
- Regime tag: bearish
On H1, price sits under all three EMAs, which are tightly clustered around $3,000 and beginning to roll over. This signals short-term control by sellers, with the moving averages forming a layered resistance block. Any push back into that $2,990–3,010 pocket is more likely to find supply than spark a breakout unless momentum meaningfully shifts.
Momentum: RSI
- RSI (14): 35.18
Hourly RSI in the mid-30s shows intraday oversold pressure building, but not yet an extreme flush. It is the kind of level where you can get sharp, mean-reverting bounces. However, within a bigger downtrend they often fade before changing the direction of travel.
Momentum & Short-Term Trend: MACD
- MACD line: -14.36
- Signal line: -8.29
- Histogram: -6.07
Here MACD is bearishly aligned: the line is below the signal and both are negative, with a widening negative histogram. That points to ongoing intraday selling pressure without clear evidence yet of an H1 momentum turn. It reinforces the idea that any long attempts on this timeframe are countertrend until these readings start to flatten or cross.
Intraday Volatility: Bollinger Bands and ATR
- BB midline: $3,000.34
- BB upper band: $3,062.36
- BB lower band: $2,938.32
- ATR (14): $22.55
ETH is sitting in the lower half of the hourly Bollinger channel, not yet pinned to the band. With an H1 ATR around $22, intraday swings of $40–50 are very plausible. From a trading perspective, that means chasing breakdowns near the lower band carries poor reward-to-risk. Better entries tend to come on fades back toward the midline or rejected tests of resistance.
Hourly Levels: Pivots
- Pivot point (PP): $2,959.17
- Resistance 1 (R1): $2,966.07
- Support 1 (S1): $2,951.48
ETH is essentially pinned around the hourly pivot, caught between a tight R1 at $2,966 and S1 at $2,951. That is a compression zone. A break and sustained trade below S1 would confirm continuation lower toward the lower hourly band near $2,940. By contrast, reclaiming and holding above R1 would be the first hint of an intraday relief bounce into the $2,980–3,000 area.
15-Minute Chart (M15) – Execution Context Only
The 15-minute chart is useful for fine-tuning entries, but it does not override the bearish picture on the higher timeframes.
Micro Trend: EMAs
- Price: $2,958.39
- EMA 20: $2,969.23
- EMA 50: $2,985.04
- EMA 200: $3,000.39
- Regime tag: bearish
Price is below all three EMAs on M15, in line with H1 and D1. This is a trend-aligned short setup environment on the micro timeframe. Rallies back toward the 20/50 EMA cluster are, by default, opportunities for sellers until proven otherwise.
Short-Term Momentum: RSI and MACD
- RSI (14): 32.96
- MACD line: -8.56
- Signal line: -9.30
- Histogram: +0.74
RSI flirting with the low 30s signals local oversold conditions. At the same time, MACD is still negative but the line has ticked just above the signal, turning the histogram slightly positive. That is often how short-term bounces start inside a downtrend: momentum stops getting worse before it actually gets positive. For intraday traders, this argues for waiting for bounces to fade rather than pressing shorts right at the lows.
Very Short-Term Volatility: Bollinger Bands, ATR, and Pivots
- BB midline: $2,966.71
- BB upper band: $2,983.44
- BB lower band: $2,949.97
- ATR (14): $8.62
- Pivot point (PP): $2,958.85
- Resistance 1 (R1): $2,959.32
- Support 1 (S1): $2,957.93
On 15 minutes, the market is essentially parked on the pivot with ultra-tight R1 and S1 boundaries. Combined with an ATR under $10, this suggests micro-consolidation before the next move. Given the higher-timeframe trend, the burden of proof is on the bulls to push away from this area and reclaim the mid-BB and EMA 20 zone around $2,965–2,970.
Market Context: Risk-Off and Extreme Fear on Ethereum price
Total crypto market cap is down over 2% in 24 hours, Bitcoin dominance is above 57%, and sentiment sits in Extreme Fear (24/100). Altcoins, including ETH, are being treated as risk assets to cut, not accumulate. Moreover, Bitcoin is setting the tone for crypto, with ETH trading as a leveraged beta play on BTC’s direction.
The dominant force now is macro risk-off plus local ETH supply. Headlines about a Thiel-backed whale entity (ETHZilla) selling tokens to cover debt only reinforce the idea that big holders are raising cash into weakness. With Ethereum’s share of total market cap just under 12%, the asset is still systemically important, but it is not driving the broader narrative.
DeFi fee data shows Uniswap v3 and v4 fees have jumped sharply day-on-day, even as 7-day averages are down. That looks like episodic volatility more than sustained activity: users are reacting to price, not driving it. It is not enough, on its own, to alter the directional call on Ethereum price.
Scenarios for Ethereum Price
Bullish Scenario
For the bullish case, think in terms of a relief rally inside a broader downtrend first, and only then a potential trend shift.
Near term, buyers need to:
- Reclaim and hold above the daily pivot at ~$2,980.
- Break and sustain above $3,015 (D1 R1), which also aligns with the 20-day EMA and daily Bollinger midline.
- On the hourly chart, push price back over the $3,000–3,010 EMA cluster and turn those moving averages flat to upward.
If that happens with daily RSI lifting back above 50 and the MACD histogram building further into positive territory, Ethereum price could target the $3,180–3,200 zone (near the 50-day EMA) as the next logical upside magnet. In an overextension, the upper daily Bollinger band around $3,310 comes into play.
What invalidates the bullish scenario?
A decisive daily close below $2,924 (D1 S1), especially if accompanied by daily RSI slipping toward 40 or lower and the MACD histogram rolling back down, would suggest the rally attempt failed. At that point, the path of least resistance reverts to a grind toward the lower Bollinger band and potentially a test of the $2,800 region.
Bearish Scenario
The bearish case is currently the base scenario: trend and structure are in its favor. In this pathway, hourly bounces toward resistance are sold into, and the market slowly bleeds lower.
Technically, bears want to see:
- Failure of any push into the $2,990–3,015 resistance pocket (H1 EMAs plus daily R1 and 20 EMA).
- An H1 close and follow-through below $2,951 (H1 S1), confirming fresh intraday lows.
- A daily close under $2,924 that keeps price anchored in the lower half of the Bollinger channel.
Under this scenario, Ethereum price drifts toward the $2,800–2,820 area (lower daily band region) as the next key demand zone. If fear persists or macro risk-off accelerates, a temporary spike even below the band is possible before any meaningful bounce.
What invalidates the bearish scenario?
A sustained reclaim of the $3,050–3,100 zone on daily closes, with price holding above the 20-day EMA and the H1 EMAs turning upward, would break the clean sequence of lower highs. If that happens while Bitcoin stabilizes and market sentiment lifts out of extreme fear, the simple sell-the-rip playbook on Ethereum would stop working.
Positioning, Risk, and Uncertainty
The current configuration says this: the trend is down, sentiment is fearful, but not exhausted. That is a good environment for disciplined trend traders and a dangerous one for traders who over-size or chase late moves.
For directional exposure, the logic is straightforward:
- The medium-term bias is bearish while ETH trades below the daily 20 EMA and under the $3,050–3,100 band.
- Short-term bounces are more likely to be countertrend rallies than the start of a new bull leg unless daily momentum genuinely shifts.
- Intraday volatility (ATR) means levels can be tested and violated quickly; risk management has to respect approximately $150 daily ranges.
None of the current signals point to an imminent trend reversal on their own. The main risk to bears is not a smooth trend change, but a sharp squeeze from oversold conditions if either macro tone improves or large sellers pause their liquidation. For bulls, the risk is assuming that extreme fear alone marks the bottom. In strongly trending markets, fear can stay extreme longer than positions can stay solvent.
In short, Ethereum price is in a controlled downtrend with room for both sides to be wrong in the short term. The high-level map is clear: below $3,000 and the 20-day EMA, the burden of proof remains on buyers.
Open your Investing.com account
This section contains a sponsored affiliate link. We may earn a commission at no additional cost to you.
This analysis is for informational and educational purposes only and is not investment, trading, or financial advice. Markets are volatile and unpredictable; always do your own research and consider your risk tolerance before making any trading decisions.


You May Also Like

Where To Watch New York Liberty Games In New York City

The U.S. Military Is Running A Bitcoin Node, Admiral Says


