BONK explodes above upper Bollinger Band as bullish momentum accelerates Overbought RSI confirms strong demand but signals short-term cooling risk Long-term outlookBONK explodes above upper Bollinger Band as bullish momentum accelerates Overbought RSI confirms strong demand but signals short-term cooling risk Long-term outlook

BONK (BONK) Price Prediction 2026–2030: Can BONK Sustain Its Breakout Rally?

  • BONK explodes above upper Bollinger Band as bullish momentum accelerates
  • Overbought RSI confirms strong demand but signals short-term cooling risk
  • Long-term outlook remains constructive if key breakout levels hold

BONK (BONK) has entered 2026 with a powerful bullish breakout, recording a daily surge of over 30% and decisively reclaiming key technical levels. The meme coin is currently trading near $0.00001226, marking one of its strongest impulsive moves in recent months.


The sharp volatility expansion signals renewed speculative interest and aggressive buyer participation. However, the speed of the rally raises questions about sustainability, as momentum indicators now reflect stretched conditions.


Also Read: Pudgy Penguins (PENGU) Price Prediction 2025–2029: Can PENGU Reclaim $0.02 Soon?


Current Market Overview

At the time of analysis, BONK is trading around $0.00001226 USDT, following a strong daily close above the 20-day simple moving average. Price has surged beyond the upper Bollinger Band, confirming a momentum-driven breakout.


This move follows weeks of consolidation and mild downside pressure in late 2025. The sudden reversal suggests a short-term shift in market structure from bearish to bullish. Still, with price now extended from its mean, consolidation or corrective pullbacks remain likely before continuation.


As long as BONK holds above its reclaimed moving average, the broader bias remains bullish.


Technical Analysis

Bollinger Bands

The Bollinger Bands on the daily timeframe show aggressive volatility expansion. The upper band is near $0.00001037, the middle band (20-day SMA) sits around $0.00000833, while the lower band rests near $0.00000630.


BONK has broken decisively above the upper band  a signal commonly associated with strong momentum phases or speculative surges. While such moves can extend in trending markets, they are often followed by pullbacks or sideways consolidation.


A successful retest of the $0.00001000–$0.00001037 region would confirm breakout strength. Failure to hold this zone could trigger a retracement toward the 20-day SMA. The widening distance between the bands highlights elevated volatility, suggesting sharp price swings may continue.


RSI Behavior

The Relative Strength Index (RSI 14) is currently near 75, placing BONK firmly in overbought territory. This reflects strong bullish dominance and heightened buying pressure.


While RSI readings above 70 often signal overheating, they do not guarantee an immediate reversal. In strong trends, RSI can remain elevated for extended periods. Traders should instead watch for RSI stabilization or bearish divergence as early signs of momentum exhaustion. A pullback toward the 60–65 RSI range would represent a healthy reset.


Support and Resistance Levels

Immediate support is located near $0.00001037, aligning with the upper Bollinger Band and the breakout base. Below this, stronger structural support sits near $0.00000833, corresponding with the 20-day moving average.


On the upside, psychological resistance appears near $0.00001500, followed by a broader resistance zone around $0.00002000, where profit-taking could intensify.


As long as BONK remains above $0.00001000, the bullish structure remains intact. A daily close below the 20-day SMA would shift momentum back toward neutral.
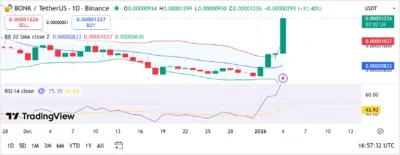

bonk

Source: Tradingview

BONK (BONK) Price Predictions (2026–2030)

YearMinimum PriceAverage PriceMaximum Price
2026$0.0000100$0.0000180$0.0000260
2027$0.0000170$0.0000250$0.0000350
2028$0.0000240$0.0000340$0.0000480
2029$0.0000320$0.0000460$0.0000650
2030$0.0000450$0.0000620$0.0000900

2026

In 2026, BONK is expected to remain highly volatile, driven by meme-coin rotations and broader crypto sentiment. Price could fluctuate between $0.0000100 and $0.0000260, with sustained trading above $0.0000130 signaling trend continuation.


2027

By 2027, BONK could benefit from improved liquidity cycles and renewed speculative interest. If accumulation persists, the average price may rise toward $0.0000250, with upside potential reaching $0.0000350.


2028

As the crypto market matures, BONK may experience more structured price behavior. Prices are expected to range between $0.0000240 and $0.0000480, supported by long-term meme asset adoption and cyclical demand.


2029

Looking ahead to 2029, BONK could establish itself as a long-standing meme asset with recurring growth cycles. Under favorable market conditions, the token could average around $0.0000460, with upside potential extending toward $0.0000650.


2030

By 2030, BONK’s long-term performance will largely depend on its ability to maintain relevance within the meme coin sector and adapt to evolving market narratives. If broader crypto adoption accelerates and speculative interest remains intact, BONK could trade between $0.0000450 and $0.0000900, with an average price near $0.0000620.


A sustained move toward the upper end of this range would likely require strong community engagement, favorable market cycles, and continued liquidity inflows.


Conclusion

BONK enters 2026 with strong bullish momentum, supported by a decisive breakout and expanding volatility. While RSI confirms overbought conditions, momentum remains firmly in buyers’ control.


Short-term pullbacks toward $0.00001037 would be constructive rather than bearish. Over the long term, if meme coin sentiment and community engagement remain strong, BONK retains meaningful upside potential through 2030, though investors should remain mindful of elevated volatility and cyclical risk.


FAQs

1. What is the current market sentiment for BONK in 2026?

Market sentiment is bullish in the short term, driven by a breakout above the 20-day moving average and strong momentum. However, elevated volatility suggests pullbacks are likely.


2. Is BONK currently overbought?

Yes. The RSI near 75 places BONK in overbought territory, signaling strong buying pressure but also a risk of short-term consolidation.


3. Can BONK sustain its rally from current levels?

BONK can sustain its rally if it holds above the $0.00001000–$0.00001037 support zone. A successful retest of this area would reinforce the bullish structure.


4. What are the key support and resistance levels to watch?

  • Support: $0.00001037, then $0.00000833


  • Resistance: $0.00001500 and $0.00002000


5. What is the long-term outlook for BONK through 2030?

If meme coin adoption and broader crypto sentiment remain favorable, BONK could trend higher over the long term, with projections ranging between $0.0000620 and $0.0000900 by 2030, though volatility will remain high.


Also Read: Flow (FLOW) Price Prediction 2025–2029: Can FLOW Recover Above $0.20?


The post BONK (BONK) Price Prediction 2026–2030: Can BONK Sustain Its Breakout Rally? appeared first on 36Crypto.

Market Opportunity
Bonk Logo
Bonk Price(BONK)
$0.000011617
$0.000011617$0.000011617
-2.82%
USD
Bonk (BONK) Live Price Chart
Disclaimer: The articles reposted on this site are sourced from public platforms and are provided for informational purposes only. They do not necessarily reflect the views of MEXC. All rights remain with the original authors. If you believe any content infringes on third-party rights, please contact service@support.mexc.com for removal. MEXC makes no guarantees regarding the accuracy, completeness, or timeliness of the content and is not responsible for any actions taken based on the information provided. The content does not constitute financial, legal, or other professional advice, nor should it be considered a recommendation or endorsement by MEXC.

You May Also Like

Franklin Templeton CEO Dismisses 50bps Rate Cut Ahead FOMC

Franklin Templeton CEO Dismisses 50bps Rate Cut Ahead FOMC

The post Franklin Templeton CEO Dismisses 50bps Rate Cut Ahead FOMC appeared on BitcoinEthereumNews.com. Franklin Templeton CEO Jenny Johnson has weighed in on whether the Federal Reserve should make a 25 basis points (bps) Fed rate cut or 50 bps cut. This comes ahead of the Fed decision today at today’s FOMC meeting, with the market pricing in a 25 bps cut. Bitcoin and the broader crypto market are currently trading flat ahead of the rate cut decision. Franklin Templeton CEO Weighs In On Potential FOMC Decision In a CNBC interview, Jenny Johnson said that she expects the Fed to make a 25 bps cut today instead of a 50 bps cut. She acknowledged the jobs data, which suggested that the labor market is weakening. However, she noted that this data is backward-looking, indicating that it doesn’t show the current state of the economy. She alluded to the wage growth, which she remarked is an indication of a robust labor market. She added that retail sales are up and that consumers are still spending, despite inflation being sticky at 3%, which makes a case for why the FOMC should opt against a 50-basis-point Fed rate cut. In line with this, the Franklin Templeton CEO said that she would go with a 25 bps rate cut if she were Jerome Powell. She remarked that the Fed still has the October and December FOMC meetings to make further cuts if the incoming data warrants it. Johnson also asserted that the data show a robust economy. However, she noted that there can’t be an argument for no Fed rate cut since Powell already signaled at Jackson Hole that they were likely to lower interest rates at this meeting due to concerns over a weakening labor market. Notably, her comment comes as experts argue for both sides on why the Fed should make a 25 bps cut or…
Share
BitcoinEthereumNews2025/09/18 00:36
Spot platinum and palladium both fell by more than 3%.

Spot platinum and palladium both fell by more than 3%.

PANews reported on January 7 that spot platinum fell more than 3% to $2,340.95 per ounce. Spot palladium fell more than 3% to $1,742.0 per ounce.
Share
PANews2026/01/07 09:55
Unprecedented Surge: Gold Price Hits Astounding New Record High

Unprecedented Surge: Gold Price Hits Astounding New Record High

BitcoinWorld Unprecedented Surge: Gold Price Hits Astounding New Record High While the world often buzzes with the latest movements in Bitcoin and altcoins, a traditional asset has quietly but powerfully commanded attention: gold. This week, the gold price has once again made headlines, touching an astounding new record high of $3,704 per ounce. This significant milestone reminds investors, both traditional and those deep in the crypto space, of gold’s enduring appeal as a store of value and a hedge against uncertainty. What’s Driving the Record Gold Price Surge? The recent ascent of the gold price to unprecedented levels is not a random event. Several powerful macroeconomic forces are converging, creating a perfect storm for the precious metal. Geopolitical Tensions: Escalating conflicts and global instability often drive investors towards safe-haven assets. Gold, with its long history of retaining value during crises, becomes a preferred choice. Inflation Concerns: Persistent inflation in major economies erodes the purchasing power of fiat currencies. Consequently, investors seek assets like gold that historically maintain their value against rising prices. Central Bank Policies: Many central banks globally are accumulating gold at a significant pace. This institutional demand provides a strong underlying support for the gold price. Furthermore, expectations around interest rate cuts in the future also make non-yielding assets like gold more attractive. These factors collectively paint a picture of a cautious market, where investors are looking for stability amidst a turbulent economic landscape. Understanding Gold’s Appeal in Today’s Market For centuries, gold has held a unique position in the financial world. Its latest record-breaking performance reinforces its status as a critical component of a diversified portfolio. Gold offers a tangible asset that is not subject to the same digital vulnerabilities or regulatory shifts that can impact cryptocurrencies. While digital assets offer exciting growth potential, gold provides a foundational stability that appeals to a broad spectrum of investors. Moreover, the finite supply of gold, much like Bitcoin’s capped supply, contributes to its perceived value. The current market environment, characterized by economic uncertainty and fluctuating currency values, only amplifies gold’s intrinsic benefits. It serves as a reliable hedge when other asset classes, including stocks and sometimes even crypto, face downward pressure. How Does This Record Gold Price Impact Investors? A soaring gold price naturally raises questions for investors. For those who already hold gold, this represents a significant validation of their investment strategy. For others, it might spark renewed interest in this ancient asset. Benefits for Investors: Portfolio Diversification: Gold often moves independently of other asset classes, offering crucial diversification benefits. Wealth Preservation: It acts as a robust store of value, protecting wealth against inflation and economic downturns. Liquidity: Gold markets are highly liquid, allowing for relatively easy buying and selling. Challenges and Considerations: Opportunity Cost: Investing in gold means capital is not allocated to potentially higher-growth assets like equities or certain cryptocurrencies. Volatility: While often seen as stable, gold prices can still experience significant fluctuations, as evidenced by its rapid ascent. Considering the current financial climate, understanding gold’s role can help refine your overall investment approach. Looking Ahead: The Future of the Gold Price What does the future hold for the gold price? While no one can predict market movements with absolute certainty, current trends and expert analyses offer some insights. Continued geopolitical instability and persistent inflationary pressures could sustain demand for gold. Furthermore, if global central banks continue their gold acquisition spree, this could provide a floor for prices. However, a significant easing of inflation or a de-escalation of global conflicts might reduce some of the immediate upward pressure. Investors should remain vigilant, observing global economic indicators and geopolitical developments closely. The ongoing dialogue between traditional finance and the emerging digital asset space also plays a role. As more investors become comfortable with both gold and cryptocurrencies, a nuanced understanding of how these assets complement each other will be crucial for navigating future market cycles. The recent surge in the gold price to a new record high of $3,704 per ounce underscores its enduring significance in the global financial landscape. It serves as a powerful reminder of gold’s role as a safe haven asset, a hedge against inflation, and a vital component for portfolio diversification. While digital assets continue to innovate and capture headlines, gold’s consistent performance during times of uncertainty highlights its timeless value. Whether you are a seasoned investor or new to the market, understanding the drivers behind gold’s ascent is crucial for making informed financial decisions in an ever-evolving world. Frequently Asked Questions (FAQs) Q1: What does a record-high gold price signify for the broader economy? A record-high gold price often indicates underlying economic uncertainty, inflation concerns, and geopolitical instability. Investors tend to flock to gold as a safe haven when they lose confidence in traditional currencies or other asset classes. Q2: How does gold compare to cryptocurrencies as a safe-haven asset? Both gold and some cryptocurrencies (like Bitcoin) are often considered safe havens. Gold has a centuries-long history of retaining value during crises, offering tangibility. Cryptocurrencies, while newer, offer decentralization and can be less susceptible to traditional financial system failures, but they also carry higher volatility and regulatory risks. Q3: Should I invest in gold now that its price is at a record high? Investing at a record high requires careful consideration. While the price might continue to climb due to ongoing market conditions, there’s also a risk of a correction. It’s crucial to assess your personal financial goals, risk tolerance, and consider diversifying your portfolio rather than putting all your capital into a single asset. Q4: What are the main factors that influence the gold price? The gold price is primarily influenced by global economic uncertainty, inflation rates, interest rate policies by central banks, the strength of the U.S. dollar, and geopolitical tensions. Demand from jewelers and industrial uses also play a role, but investment and central bank demand are often the biggest drivers. Q5: Is gold still a good hedge against inflation? Historically, gold has proven to be an effective hedge against inflation. When the purchasing power of fiat currencies declines, gold tends to hold its value or even increase, making it an attractive asset for preserving wealth during inflationary periods. To learn more about the latest crypto market trends, explore our article on key developments shaping Bitcoin’s price action. This post Unprecedented Surge: Gold Price Hits Astounding New Record High first appeared on BitcoinWorld.
Share
Coinstats2025/09/18 02:30