With a 28% rally over the past four days, Dogecoin (DOGE/USDT) is back at a familiar decision point on higher timeframes, with three analysts leaning toward “pullbackWith a 28% rally over the past four days, Dogecoin (DOGE/USDT) is back at a familiar decision point on higher timeframes, with three analysts leaning toward “pullback

Is The Dogecoin Rally A Dead Cat Bounce? Analysts Weigh In

2026/01/05 17:00

With a 28% rally over the past four days, Dogecoin (DOGE/USDT) is back at a familiar decision point on higher timeframes, with three analysts leaning toward “pullback-then-continue” rather than a simple fade, so long as a key Fibonacci reclaim holds.

Across the 4H, weekly, and monthly charts shared by Matt Hughes (@matthughes13), Byzantine General (@ByzGeneral), and Cantonese Cat (@cantonmeow), the market is framed as strong but now confronting nearby resistance after a sharp move.

Is Dogecoin’s Rally A Dead Cat Bounce?

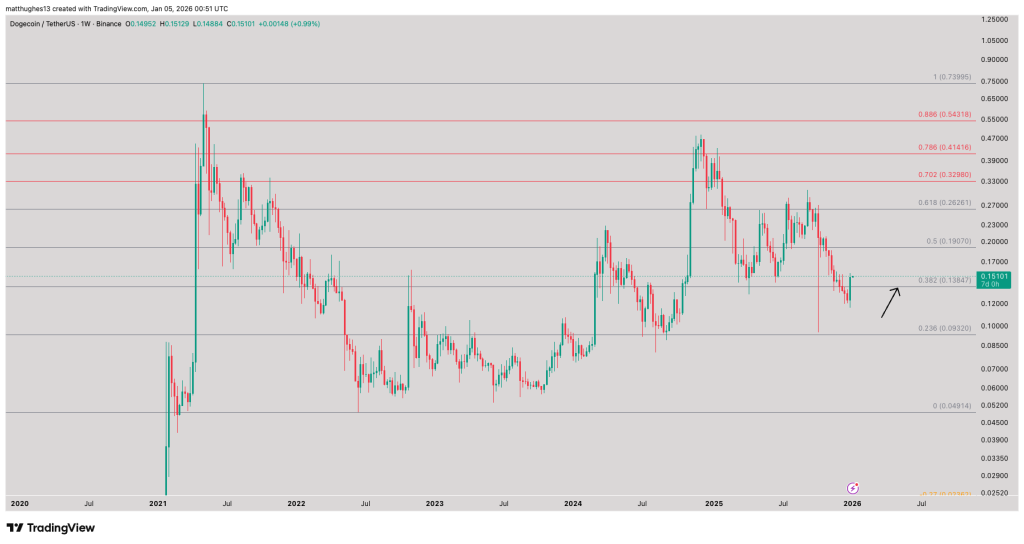
Matt Hughes’ core tell is the weekly 0.382 retracement at 0.13847, which his chart highlights as the pivot level bulls needed to regain. He put it plainly: “DOGE regaining the .382 fib at .13847 is bullish for continuation higher. It was just a few days ago when some people were bearish at this major support zone that I pointed out in the post below” He anchored that read to the prior demand area he’d flagged last week: “Risk/reward in the .11-.12 zone for DOGE is incredible here.”

Dogecoin weekly chart

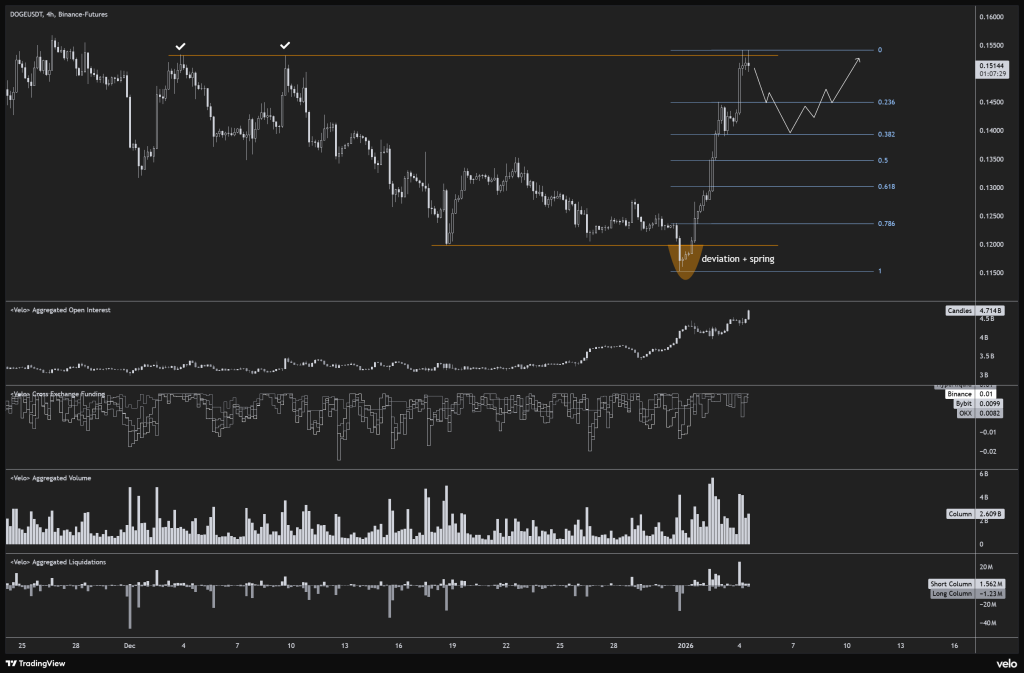
The most recent, lower-timeframe view (DOGEUSDT 4H, Binance futures) shows why “dead cat bounce” talk is tempting: price ripped higher, tagged the prior range highs, and then backed off, exactly the kind of sequence that can either turn into a clean retest or an abrupt rollover.

Byzantine General’s take matches that posture. He expects a reset to the $0.14 region, before the rally resumes: “DOGE made a pretty incredible move. After taking out the range highs I think a little pullback makes sense, but it still looks very strong overall.”

On the same 4H layout, the move is accompanied by rising derivatives positioning, Velo’s aggregated open interest is shown pushing up to 4.714B, while cross-exchange funding reads positive (Binance 0.01, Bybit 0.0099, OKX 0.0082), consistent with a market leaning long but not obviously depicted as euphoric in these panels.

Dogecoin 4-hour chart

Cantonese Cat’s framing is more tactical: the rally can still “work,” but only if it respects the structure and reacts cleanly at resistance. He wrote: “DOGE maybe hitting resistance here soon Let’s see how it reacts there So far it’s just been a brutal retrace to 0.382, which still makes this a valid handle for the big 4-year cup and handle formation.”

After price met that area, he followed up: “Literally right on the money with resistance. Now what? We’ve got a whole month ahead of us. Let’s see how DOGE does it from here on out.”

Dogecoin monthly chart

On the 4-hour chart by Hughes, the roadmap is explicit: the 0.382 level sits at 0.13847, with the next marked retracements above at 0.19070 (0.5) and 0.26261 (0.618).

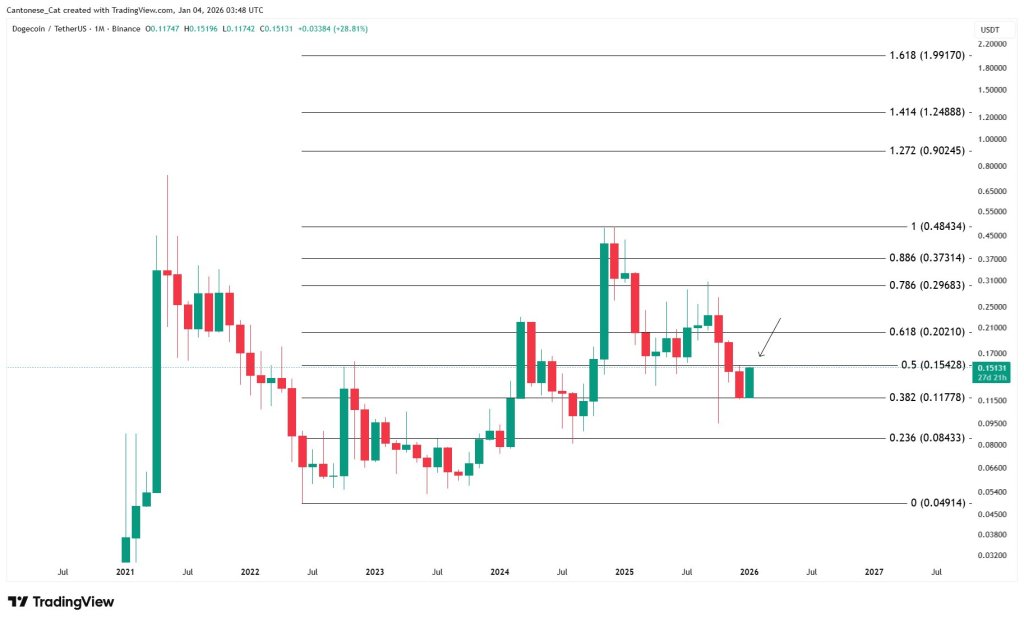
The monthly view reinforces that the current zone is a tight band between 0.11778 (0.382) and 0.15428 (0.5), with 0.20210 (0.618) above, useful reference points for where continuation would need to prove itself, step by step, rather than in a single candle.

That leaves the “dead cat bounce” question mostly conditional. If DOGE can keep weekly acceptance above 0.13847 and reclaim the nearby monthly 0.15428 area (the same neighborhood as the prior range highs on the 4H), the analysts’ shared bias reads as consolidation-before-extension.

If price loses 0.13847 again, the setup starts to look more like a failed reclaim, with the lower marked supports on the charts at 0.11778 and 0.09320 coming back into focus.

At press time, DOGE traded at $0.14944.

Dogecoin price chart
Market Opportunity
Simons Cat Logo
Simons Cat Price(CAT)
$0.000003246
$0.000003246$0.000003246
-2.40%
USD
Simons Cat (CAT) Live Price Chart
Disclaimer: The articles reposted on this site are sourced from public platforms and are provided for informational purposes only. They do not necessarily reflect the views of MEXC. All rights remain with the original authors. If you believe any content infringes on third-party rights, please contact service@support.mexc.com for removal. MEXC makes no guarantees regarding the accuracy, completeness, or timeliness of the content and is not responsible for any actions taken based on the information provided. The content does not constitute financial, legal, or other professional advice, nor should it be considered a recommendation or endorsement by MEXC.

You May Also Like

USDC Surpasses USDT in Growth for Second Year

USDC Surpasses USDT in Growth for Second Year

The post USDC Surpasses USDT in Growth for Second Year appeared on BitcoinEthereumNews.com. Key Points: USDC’s growth continues to exceed USDT for the second year
Share
BitcoinEthereumNews2026/01/07 06:21
Trump must print—and keep gas cheap—for Bitcoin to rip: Arthur Hayes

Trump must print—and keep gas cheap—for Bitcoin to rip: Arthur Hayes

BitMEX co-founder Arthur Hayes is betting that U.S. politics, not crypto fundamentals, will drive the next major leg higher for BTC.
Share
Crypto.news2026/01/07 06:41
Cryptos Signal Divergence Ahead of Fed Rate Decision

Cryptos Signal Divergence Ahead of Fed Rate Decision

The post Cryptos Signal Divergence Ahead of Fed Rate Decision appeared on BitcoinEthereumNews.com. Crypto assets send conflicting signals ahead of the Federal Reserve’s September rate decision. On-chain data reveals a clear decrease in Bitcoin and Ethereum flowing into centralized exchanges, but a sharp increase in altcoin inflows. The findings come from a Tuesday report by CryptoQuant, an on-chain data platform. The firm’s data shows a stark divergence in coin volume, which has been observed in movements onto centralized exchanges over the past few weeks. Bitcoin and Ethereum Inflows Drop to Multi-Month Lows Sponsored Sponsored Bitcoin has seen a dramatic drop in exchange inflows, with the 7-day moving average plummeting to 25,000 BTC, its lowest level in over a year. The average deposit per transaction has fallen to 0.57 BTC as of September. This suggests that smaller retail investors, rather than large-scale whales, are responsible for the recent cash-outs. Ethereum is showing a similar trend, with its daily exchange inflows decreasing to a two-month low. CryptoQuant reported that the 7-day moving average for ETH deposits on exchanges is around 783,000 ETH, the lowest in two months. Other Altcoins See Renewed Selling Pressure In contrast, other altcoin deposit activity on exchanges has surged. The number of altcoin deposit transactions on centralized exchanges was quite steady in May and June of this year, maintaining a 7-day moving average of about 20,000 to 30,000. Recently, however, that figure has jumped to 55,000 transactions. Altcoins: Exchange Inflow Transaction Count. Source: CryptoQuant CryptoQuant projects that altcoins, given their increased inflow activity, could face relatively higher selling pressure compared to BTC and ETH. Meanwhile, the balance of stablecoins on exchanges—a key indicator of potential buying pressure—has increased significantly. The report notes that the exchange USDT balance, around $273 million in April, grew to $379 million by August 31, marking a new yearly high. CryptoQuant interprets this surge as a reflection of…
Share
BitcoinEthereumNews2025/09/18 01:01