Bitcoin ETFs Bleed $243M Amid Market Pullback — Is the Rally Over?
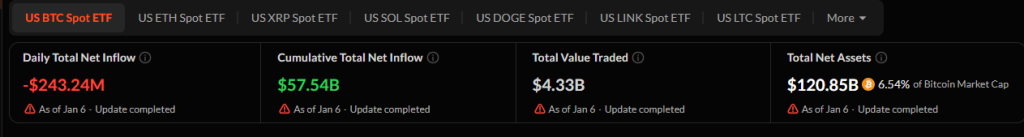
Bitcoin spot exchange-traded funds recorded a sharp reversal in daily flows on January 6, shedding a combined $243.24 million as markets pulled back.
The pullback raises fresh questions about whether the recent rally is losing momentum or simply pausing after weeks of heavy inflows.
 Source: Sosovalue
The outflow marked a clear contrast to the prior trading sessions, but broader data suggests investor interest remains structurally intact rather than broken.
Bitcoin ETFs See Brief Dip, but Big Money Stays Put
SoSoValue data shows that despite the one-day drawdown, cumulative net inflows across all U.S. spot Bitcoin ETFs stood at $57.54 billion since launch.
Total assets held by the products amounted to $120.85 billion, equivalent to about 6.54% of Bitcoin’s total market capitalization.
Trading activity also remained active, with $4.33 billion in value exchanged across the funds on the day, pointing to repositioning rather than an outright exit.
Fund-level data shows that the pullback was not evenly distributed.
BlackRock’s iShares Bitcoin Trust continued to absorb capital, recording a daily net inflow of $228.66 million, equivalent to roughly 2,470 BTC.
IBIT now holds $72.15 billion in net assets, with cumulative inflows of $62.98 billion, giving it the largest share of the Bitcoin ETF market.
The fund traded more than $529 million in value on the day, even as its price slipped 1.33% to $51.76.
The overall outflow was driven largely by redemptions elsewhere.
 Source: Sosovalue
Fidelity’s FBTC saw $312.24 million exit the fund, the largest daily outflow among issuers, while Grayscale’s GBTC continued its long-running bleed with $83.07 million leaving on the day.
GBTC’s cumulative net outflows have now reached $25.32 billion, though it still holds $15.17 billion in assets.
Grayscale’s newer low-fee BTC product also recorded a $32.73 million outflow, while ARK 21Shares’ ARKB and VanEck’s HODL posted smaller redemptions.
Several funds, including Bitwise’s BITB and Invesco’s BTCO, saw flat flows, suggesting a pause rather than a broad exit.
ETF Volatility Emerges, but Bitcoin Shows Resilience
The negative daily print followed a strong start to the year. On January 5, Bitcoin ETFs posted $697.25 million in net inflows, while January 2 saw $471.14 million enter the products.
On a weekly basis, flows remained positive, with $454.01 million added by the week ending January 6.
Source: Sosovalue
January as a whole has already logged $925.15 million in net inflows, reversing December’s $1.09 billion monthly outflow and pushing total assets higher month over month.
Bitcoin itself has shown resilience despite ETF volatility. The asset is trading around $91,119, up 3.1% over the past 24 hours, with daily trading volume rising more than 22% to $61.56 billion.
Source: Cryptonews
While still nearly 28% below its all-time high of $126,080, Bitcoin has posted modest gains across weekly and biweekly time frames, reinforcing the view that the ETF pullback aligns with routine profit-taking rather than a decisive trend reversal.
Broader developments continue to support that interpretation. Spot Bitcoin ETFs generated roughly $21.8 billion in net inflows during 2025, making them one of the most successful ETF product launches on record, even as inflows slowed from 2024’s pace.
Institutional engagement also appears to be expanding.
Morgan Stanley filed registration statements on January 6 to launch its own spot Bitcoin ETF, alongside proposed Ethereum and Solana trusts.
The move shows the ongoing interest from major financial institutions, even as short-term flows fluctuate.
Meanwhile, Ethereum spot ETFs continued to attract capital. U.S. ETH ETFs recorded $114.74 million in net inflows on the same day Bitcoin products saw outflows, lifting cumulative ETH inflows to $12.79 billion.
Source: Sosovalue
BlackRock’s ETHA again led the group, highlighting that investor demand for regulated crypto exposure remains diversified rather than singularly focused on Bitcoin.


You May Also Like

Is Trump Manipulating the Crypto Market?

Robotics Automation Prototyping: Engineering Kinetic Agility into End-Effectors