Crypto markets surged today as Bitcoin pushed toward $94,000 and Ethereum broke above $3,200. With a major US Supreme Court ruling expected tomorrow, traders areCrypto markets surged today as Bitcoin pushed toward $94,000 and Ethereum broke above $3,200. With a major US Supreme Court ruling expected tomorrow, traders are

Will Tomorrow’s News Stop the Crypto Bull Run?

2026/01/14 03:13
3 min read

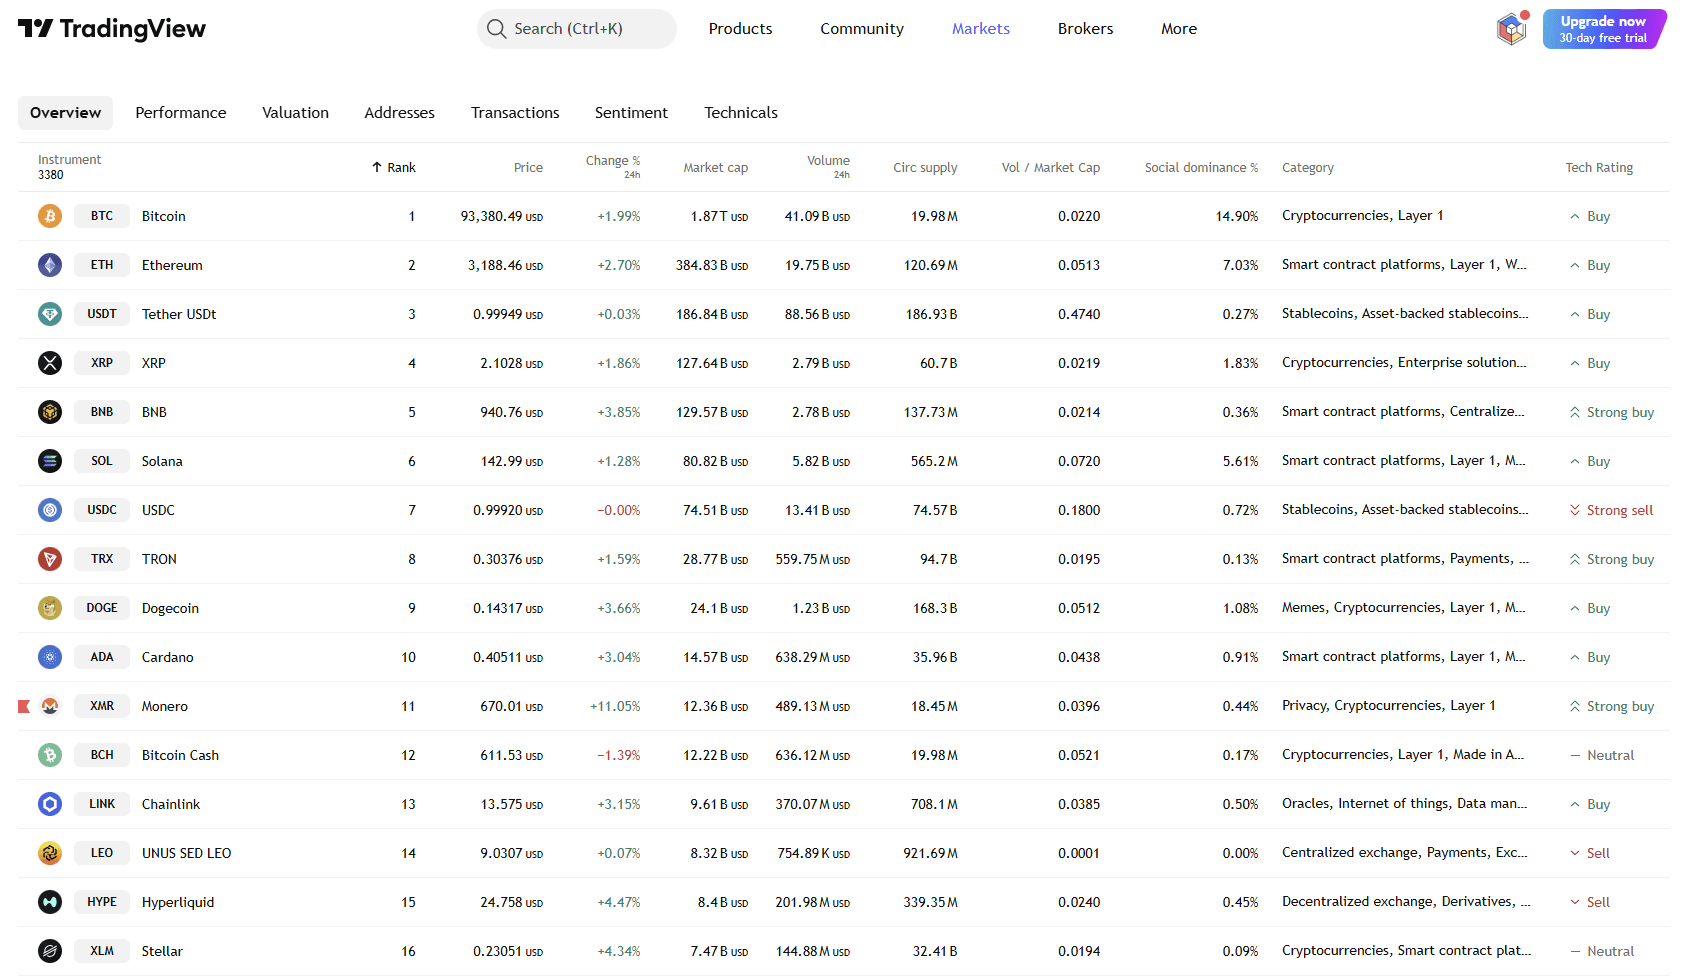
Crypto markets are ending the day on a strong note, driven by a broad risk-on move across Bitcoin, Ethereum, and major altcoins. Bitcoin is holding above the $93,000 area, Ethereum has reclaimed $3,200, and market sentiment has clearly shifted bullish.

However, attention is now turning to tomorrow’s expected US Supreme Court ruling on President Trump’s tariffs, a macro event that could inject volatility into both traditional markets and crypto. The key question is simple: can tomorrow’s news stop today’s bull run?

Why Crypto Is Rallying Today

Today’s rally is not just headline-driven hype. Several factors are aligning at the same time:

  1. Bitcoin remains above $93K, pressing toward the key $94K resistance
  2. Ethereum confirmed a breakout above $3,200, strengthening overall market confidence
  3. Altcoins are following Bitcoin, not lagging — a healthy sign for market structure
  4. Macro narrative favors crypto:
    • President Trump continues to publicly criticize Fed Chair Jerome Powell
    • Markets are increasingly pricing in future rate cuts
    • Political uncertainty is reinforcing Bitcoin’s hedge narrative

Together, these elements have created a solid bullish setup going into tomorrow.

By TradingView - 2026-01-13 (All).pngBy TradingView - 2026-01-13 (All)

The Key Event Tomorrow: Supreme Court Tariffs Ruling

The market is focused on one major catalyst:
👉 The US Supreme Court ruling on Trump’s tariffs, with prediction markets currently showing a high probability that the tariffs will be ruled illegal.

Scenario 1: Tariffs Are Ruled Illegal (Base Case)

If the court rules the tariffs illegal, markets are likely to interpret this as:

  • Reduced trade uncertainty
  • A softer US dollar
  • Continued support for risk assets

Crypto impact:

  • Bitcoin likely holds above $92,000–$93,000
  • Ethereum remains supported above $3,150–$3,200
  • Altcoins consolidate or grind higher

In this scenario, the bull run is unlikely to stop. At most, markets may pause or consolidate after today’s strong move.

Scenario 2: Court Rules in Favor of Tariffs (Surprise Outcome)

A ruling in favor of tariffs would be a negative surprise and could trigger a short-term risk-off reaction.

Possible reaction:

  • Temporary sell-off in risk assets
  • Increased volatility across crypto markets

Key levels to watch:

  • Bitcoin could pull back toward $90,000–$91,000
  • Ethereum could retest $3,050–$3,100

However, unless this outcome is followed by hawkish Fed commentary, a strong dollar breakout, or heavy ETF selling, such a move would likely be a pullback — not a trend reversal.

Technical Outlook: Structure Still Favors Bulls

From a technical perspective, the market remains constructive:

  • Bitcoin is consolidating below resistance, not rejecting it
  • Ethereum’s breakout adds confirmation across majors
  • Volume is expanding rather than fading
  • No clear bearish divergence has appeared on higher timeframes

This suggests that negative headlines would likely cause volatility, not a structural breakdown.

What Traders Should Expect Tomorrow

  • Increased volatility around headlines
  • Possible sharp intraday swings
  • Direction decided by daily close, not short-term spikes

Key Bitcoin levels:

  • Above $92K → bull structure remains intact
  • Break above $94K → opens the door toward $98K–$100K
  • Below $90K → short-term correction, broader bull trend still alive

Conclusion

Tomorrow’s news may slow momentum or trigger brief pullbacks, but it is unlikely to end the crypto bull run outright. As long as Bitcoin holds key support levels and macro conditions remain supportive, the broader trend continues to favor the upside.

For now, traders should prepare for volatility — not panic.

Market Opportunity
LETSTOP Logo
LETSTOP Price(STOP)
$0.01502
$0.01502$0.01502
-0.72%
USD
LETSTOP (STOP) Live Price Chart
Disclaimer: The articles reposted on this site are sourced from public platforms and are provided for informational purposes only. They do not necessarily reflect the views of MEXC. All rights remain with the original authors. If you believe any content infringes on third-party rights, please contact crypto.news@mexc.com for removal. MEXC makes no guarantees regarding the accuracy, completeness, or timeliness of the content and is not responsible for any actions taken based on the information provided. The content does not constitute financial, legal, or other professional advice, nor should it be considered a recommendation or endorsement by MEXC.

You May Also Like

BlackRock boosts AI and US equity exposure in $185 billion models

BlackRock boosts AI and US equity exposure in $185 billion models

The post BlackRock boosts AI and US equity exposure in $185 billion models appeared on BitcoinEthereumNews.com. BlackRock is steering $185 billion worth of model portfolios deeper into US stocks and artificial intelligence. The decision came this week as the asset manager adjusted its entire model suite, increasing its equity allocation and dumping exposure to international developed markets. The firm now sits 2% overweight on stocks, after money moved between several of its biggest exchange-traded funds. This wasn’t a slow shuffle. Billions flowed across multiple ETFs on Tuesday as BlackRock executed the realignment. The iShares S&P 100 ETF (OEF) alone brought in $3.4 billion, the largest single-day haul in its history. The iShares Core S&P 500 ETF (IVV) collected $2.3 billion, while the iShares US Equity Factor Rotation Active ETF (DYNF) added nearly $2 billion. The rebalancing triggered swift inflows and outflows that realigned investor exposure on the back of performance data and macroeconomic outlooks. BlackRock raises equities on strong US earnings The model updates come as BlackRock backs the rally in American stocks, fueled by strong earnings and optimism around rate cuts. In an investment letter obtained by Bloomberg, the firm said US companies have delivered 11% earnings growth since the third quarter of 2024. Meanwhile, earnings across other developed markets barely touched 2%. That gap helped push the decision to drop international holdings in favor of American ones. Michael Gates, lead portfolio manager for BlackRock’s Target Allocation ETF model portfolio suite, said the US market is the only one showing consistency in sales growth, profit delivery, and revisions in analyst forecasts. “The US equity market continues to stand alone in terms of earnings delivery, sales growth and sustainable trends in analyst estimates and revisions,” Michael wrote. He added that non-US developed markets lagged far behind, especially when it came to sales. This week’s changes reflect that position. The move was made ahead of the Federal…
Share
BitcoinEthereumNews2025/09/18 01:44
Litecoin Fluctuates Below The $116 Threshold

Litecoin Fluctuates Below The $116 Threshold

The post Litecoin Fluctuates Below The $116 Threshold appeared on BitcoinEthereumNews.com. Sep 17, 2025 at 23:05 // Price Litecoin price analysis by Coinidol.com: LTC price has slipped below the moving average lines after hitting resistance at $120. Litecoin price long-term prediction: bearish The 21-day SMA support helped to alleviate the selling pressure. In other words, the price of the cryptocurrency is above the 21-day SMA support but below the 50-day SMA barrier. This suggests that Litecoin will be trapped in a narrow range for a few days. If the 21-day SMA support or the 50-day SMA barrier is overreached, the cryptocurrency will trend upwards. For example, if the LTC price breaks through the 50-day SMA barrier, it will rise to a high of $124. Litecoin will fall to its current support level of $106 if the 21-day SMA support is broken. Technical Indicators  Resistance Levels: $100, $120, $140 Support Levels: $60, $40, $20 LTC price indicators analysis Litecoin’s price is squeezed between the moving average lines. It is unclear in which direction Litecoin will move. The moving average lines are horizontal in both charts. However, the price bars are limited to the distance between the moving averages. The price bars on the 4-hour chart are below the moving average lines. LTC/USD price chart – September 17, 2025 What is the next move for LTC? On the 4-hour chart, Litecoin is currently trading in a bearish trend zone. The altcoin is trading above the $112 support and below the moving average lines, which represent resistance at $116. The upward movement is hindered by the moving average lines, which are causing the price to oscillate within a limited range. Meanwhile, the signal for the cryptocurrency is bearish, with price bars below the moving average…
Share
BitcoinEthereumNews2025/09/18 08:15
TBC Bank Recognized as a Fintech Leader in Uzbekistan for AI and Digital Innovation

TBC Bank Recognized as a Fintech Leader in Uzbekistan for AI and Digital Innovation

TBC Bank, a prominent player in Uzbekistan’s banking sector, has rapidly become one of the leaders in fintech, driving digital transformation and innovative financial
Share
Techbullion2026/02/28 08:39