The post Polkadot (DOT) Breakout Has Paused: Why The Silence Around DOT Matters appeared first on Coinpedia Fintech News Polkadot (DOT) recent rally has cooledThe post Polkadot (DOT) Breakout Has Paused: Why The Silence Around DOT Matters appeared first on Coinpedia Fintech News Polkadot (DOT) recent rally has cooled

Polkadot (DOT) Breakout Has Paused: Why The Silence Around DOT Matters

DOT price

The post Polkadot (DOT) Breakout Has Paused: Why The Silence Around DOT Matters appeared first on Coinpedia Fintech News

Polkadot (DOT) recent rally has cooled, but the market doesn’t appear concerned. After briefly pushing higher earlier this month, Polkadot price eased into a tight range near $2.10-$2.20, calming alongside a broader pause across altcoin markets. At first look, the sideways move looks unremarkable, but price structure tells a more interesting story beneath the surface.

The Polkadot price is holding ground and the reversal is still in shape, and the market participants which rushed during the breakout now appear to be watching rather than chasing. For Polkadot (DOT), the momentum cool-off is less about exhaustion and more about whether buyers are willing to stay once the excitement fades: And that question is now being answered on the price chart.

What Sparked the DOT Reversal Move

Polkadot (DOT) price reversal didn’t come out of nowhere. Earlier developments from two fronts, a Robinhood listing expanded retail access, while broader narratives around institutional exposure, including Grayscale-linked discussions, added credibility to DOT moving around the demand zone.

That combination pushed DOT out of a prolonged downtrend and a sharp reversal rally was noted in the early 2026. Since then, DOT has gained traction and shifted gears from reacting to headlines to evaluating whether breakout could extend further without constant catalysts.

What Polkadot (DOT) Price Chart Shows Right Now

Polkadot (DOT) price chart reflects a meaningful shift in structure followed by a controlled pause rather than losing momentum. After spending several weeks of downtrend inside a descending wedge pattern, DOT has broken the series of lower lows and shown a reversal.

DOT price

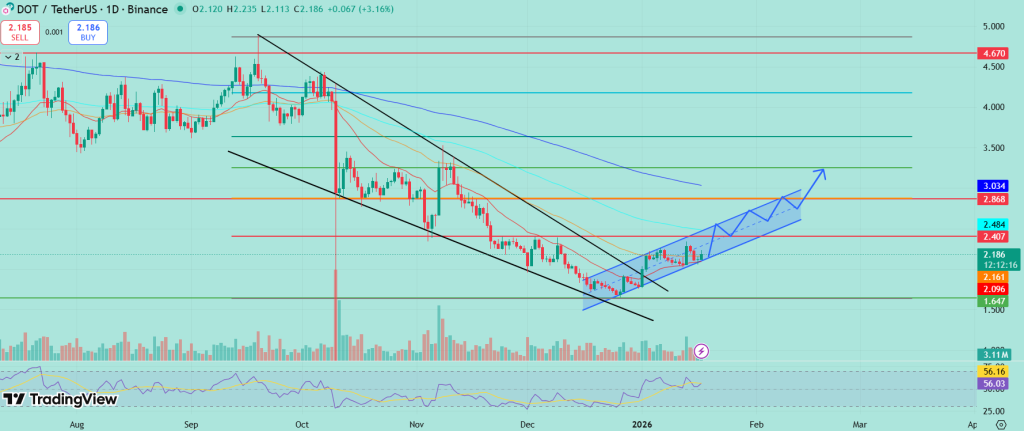
Following a price reversal, DOT has started surging inside an ascending channel forming higher highs, that move carried DOT above the $2 level. Since the rebound from the demand zone of $1.80, DOT’s short-term moving averages flipped upwards and the momentum indicators also revealed a positive outlook.

As long as the DOT price holds above the $2 support zone, the bullish structure remains valid and a break above the $2.30 mark would open the doors toward $2.80 followed by $3.20 in the near term.

On-Chain Metrics Points to Bullish Outlook

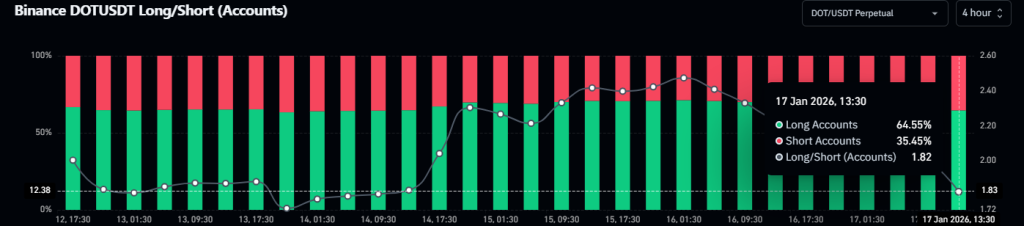
Data from Coinglass highlights that traders betting more on the long-side, compared to those taking the short-side. At press time, DOT’s Long/Short ratio noted at 1.82, outlining the bullish outlook. However, the major liquidation cluster stood at $2.28 where $786K worth of short positions exists.

DOT price

Alongside the DOT’s price surge of over 3.20% , the Open Interest (OI) data showed a rise over 7.30% to $211.77 Million, revealing bullish positioning in the market. 

Polkadot’s next move will be decided by levels, not headlines. As long as DOT remains inside the ascending channel above $2, the reversal is intact and a push beyond $2.50 would bring more strength. While if breaks below $2, short term consolidation may be seen ahead.

Market Opportunity
Polkadot Logo
Polkadot Price(DOT)
$2,202
$2,202$2,202
-0,36%
USD
Polkadot (DOT) Live Price Chart
Disclaimer: The articles reposted on this site are sourced from public platforms and are provided for informational purposes only. They do not necessarily reflect the views of MEXC. All rights remain with the original authors. If you believe any content infringes on third-party rights, please contact service@support.mexc.com for removal. MEXC makes no guarantees regarding the accuracy, completeness, or timeliness of the content and is not responsible for any actions taken based on the information provided. The content does not constitute financial, legal, or other professional advice, nor should it be considered a recommendation or endorsement by MEXC.

You May Also Like

Ripple (XRP) Pushes Upwards While One New Crypto Explodes in Popularity

Ripple (XRP) Pushes Upwards While One New Crypto Explodes in Popularity

The post Ripple (XRP) Pushes Upwards While One New Crypto Explodes in Popularity appeared on BitcoinEthereumNews.com. As Ripple (XRP) is slowly recovering through
Share
BitcoinEthereumNews2026/01/18 02:41
Polygon Tops RWA Rankings With $1.1B in Tokenized Assets

Polygon Tops RWA Rankings With $1.1B in Tokenized Assets

The post Polygon Tops RWA Rankings With $1.1B in Tokenized Assets appeared on BitcoinEthereumNews.com. Key Notes A new report from Dune and RWA.xyz highlights Polygon’s role in the growing RWA sector. Polygon PoS currently holds $1.13 billion in RWA Total Value Locked (TVL) across 269 assets. The network holds a 62% market share of tokenized global bonds, driven by European money market funds. The Polygon POL $0.25 24h volatility: 1.4% Market cap: $2.64 B Vol. 24h: $106.17 M network is securing a significant position in the rapidly growing tokenization space, now holding over $1.13 billion in total value locked (TVL) from Real World Assets (RWAs). This development comes as the network continues to evolve, recently deploying its major “Rio” upgrade on the Amoy testnet to enhance future scaling capabilities. This information comes from a new joint report on the state of the RWA market published on Sept. 17 by blockchain analytics firm Dune and data platform RWA.xyz. The focus on RWAs is intensifying across the industry, coinciding with events like the ongoing Real-World Asset Summit in New York. Sandeep Nailwal, CEO of the Polygon Foundation, highlighted the findings via a post on X, noting that the TVL is spread across 269 assets and 2,900 holders on the Polygon PoS chain. The Dune and https://t.co/W6WSFlHoQF report on RWA is out and it shows that RWA is happening on Polygon. Here are a few highlights: – Leading in Global Bonds: Polygon holds 62% share of tokenized global bonds (driven by Spiko’s euro MMF and Cashlink euro issues) – Spiko U.S.… — Sandeep | CEO, Polygon Foundation (※,※) (@sandeepnailwal) September 17, 2025 Key Trends From the 2025 RWA Report The joint publication, titled “RWA REPORT 2025,” offers a comprehensive look into the tokenized asset landscape, which it states has grown 224% since the start of 2024. The report identifies several key trends driving this expansion. According to…
Share
BitcoinEthereumNews2025/09/18 00:40
Secure the $0.001 Price Before the BlockDAG Presale Ends in 10 Days: Is This the Best Crypto to Buy Today?

Secure the $0.001 Price Before the BlockDAG Presale Ends in 10 Days: Is This the Best Crypto to Buy Today?

Secure your position during the final 12 days of the BlockDAG presale at $0.001 before market forces take over. Learn why this Layer-1 project is seeing massive
Share
CoinLive2026/01/18 02:00