

Avalanche Daily Active Addresses Hit New Peak: Will AVAX Re-enter Top 10?
Avalanche AVAX $12.80 24h volatility: 6.2% Market cap: $5.52 B Vol. 24h: $404.08 M has recently seen a sharp spike in network use. On Jan. 19, daily active addresses on Avalanche C Chain reached 1.71 million, the highest level ever recorded. Before this, daily addresses stayed mostly around 300,000-600,000.
The move points to renewed use across apps, transfers, and on-chain actions. Over the past year, Avalanche has become 43 times more cost-efficient.
In 2025, daily transactions increased 153.6% year over year to an average of 4.2 million. Daily active addresses climbed 379.6% year over year to 380,000. Total transactions reached 1.45 billion, up 152.9% from 2024.
Avalanche continues to post fast finality of about two seconds, low fees, and throughput above 4,500 transactions per second.
AVX Price Drops Despite Network Strength
Despite the growing on-chain activity, the Avalanche token (AVAX) continues to struggle. On Jan. 19, AVAX saw a major price drop amid a broader crypto market downturn. At the time of writing, AVAX is trading around $12.59, down by 7.5% over the past day.
Notably, AVAX has been trending lower after surging above $35 in September last year. Since then, the token’s market cap has fallen by about $9.44 billion and currently sits near $5.43 billion. AVAX is now ranked 20th by market cap.
Sharp Move Ahead?
Momentum readings show AVAX at its weakest level since the 2022-2023 bear market low. Historically, such periods lead to late-stage sell pressure and a potential sharp move if risk conditions turn.
On the daily chart, AVAX is trading below the mid Bollinger Band (20-day SMA). Price recently tagged the lower band near $12, a zone where short-term selling pressure surges. If the token fails to hold $12, it could risk a drop toward $10.50.
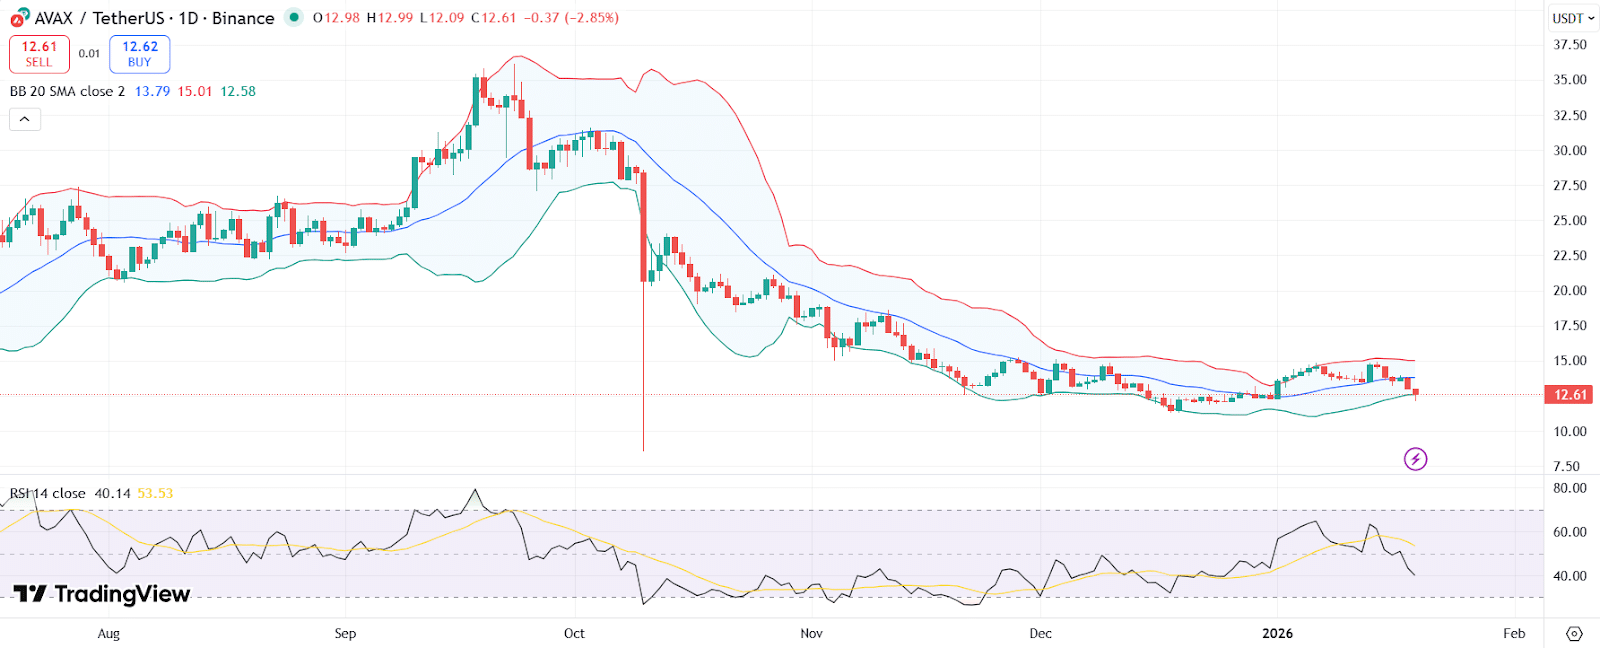
AVAX price chart with RSI and Bollinger Bands | Source: TradingView
Meanwhile, RSI is below neutral but not yet extreme. A price increase above $13.80 could lead the token to the upper Bollinger Band around $15. If AVAX manages to close above $16, it would confirm a trend reversal and potential price rally.
nextThe post Avalanche Daily Active Addresses Hit New Peak: Will AVAX Re-enter Top 10? appeared first on Coinspeaker.


You May Also Like

PMI-ACP Exam Preparation: How to Use a Simulator and Practice Questions Effectively

Bitcoin (BTC) Hovers Above $77K Amid Iran Diplomacy and Rising Treasury Yields


