

XRP Price Analysis: Technical Structures Hint at Potential $4 Breakout
TLDR
- XRP price trades within a descending channel, showing early reversal signals.
- Market cycle structure points to consolidation transitioning into accumulation.
- Stabilization above key support suggests selling pressure is fading.
- Strong relative strength hints at underlying demand ahead of a potential $4 move.
XRP price is signalling stabilization as analysts track developing reversal patterns across multiple charts. Recent technical setups suggest consolidation may be transitioning into accumulation, with projections pointing toward a potential move to the $4.00 level. Analysts focus on channel behavior, broader cycle structure, and relative strength metrics.
XRP Price Trades in Descending Channel With Reversal Signals
According to analyst DonWedge, XRP price is within a clearly defined descending channel. Despite the downward slope, the price has respected both channel boundaries with clean reactions. This behavior points to controlled selling pressure rather than aggressive distribution.
Notably, reaction lows near the lower channel boundary are gradually rising. This suggests sellers are losing momentum with each attempt to push price lower. RSI readings remain stable and avoid oversold territory, reinforcing the idea that downside pressure is being absorbed.

From a technical projection perspective, the analyst noted that a confirmed breakout above the channel could trigger volatility expansion. Based on the channel height, a move toward $4.00 is technically viable once resistance is reclaimed. Until then, consolidation within the structure remains constructive.
Market Cycle Shows Controlled XRP Price Consolidation
Meanwhile, analyst BitGuru’s chart provides a wider view of XRP’s market cycle. The structure begins with a sharp bullish impulse, followed by an extended consolidation phase. During this period, XRP price moved sideways, allowing leverage to reset without damaging the broader trend.
Following consolidation, XRP price entered a controlled downtrend marked by orderly lower highs. Volume declined and volatility compressed, differentiating this phase from capitulation. Such behavior often reflects redistribution rather than panic selling.

Currently, XRP price is stabilizing above a key horizontal support level. This stabilization suggests selling pressure may be largely exhausted. If price can reclaim prior range highs, the structure supports a renewed upside leg rather than prolonged weakness.
Relative Strength Metrics Highlight Underlying XRP Demand
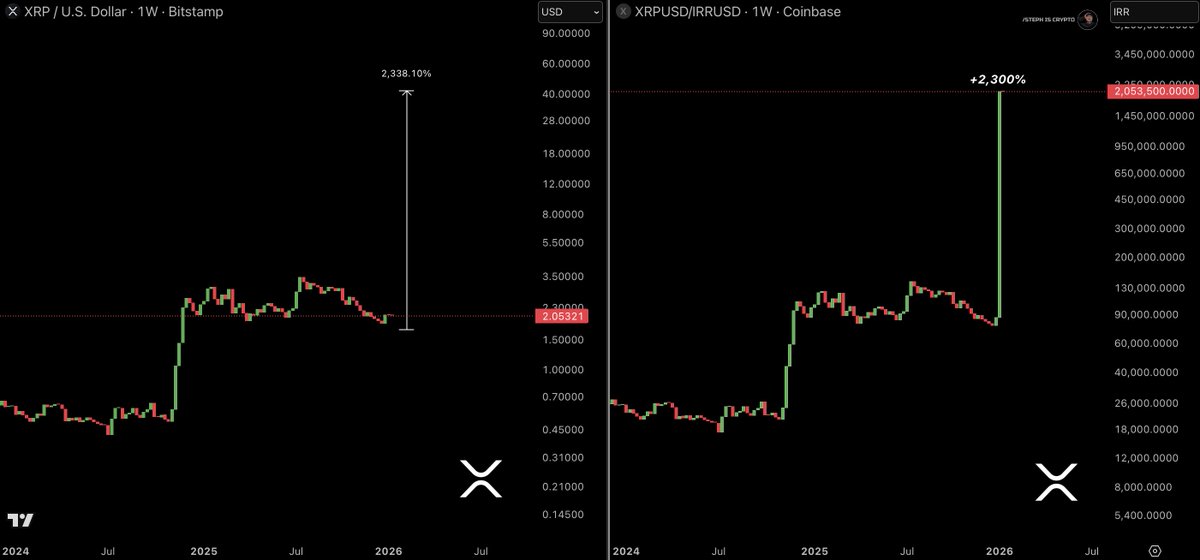
In addition, analyst Steph Is Crypto examined XRP price through a relative-strength comparison against the Iranian Rial. The chart highlights a +2300% weekly candle, reflecting extreme outperformance during periods of local currency debasement. While not a direct predictor of USD pricing, it provides valuable macro context.
Historically, such relative-strength explosions have occurred before or during major repricing events in USD pairs. They reflect capital rotation into digital assets when fiat confidence erodes. This reinforces XRP’s role as a liquidity-focused asset rather than a purely speculative instrument.
Moreover, previous cycles have shown that strong relative performance often leads to USD price action with a delay. While XRP price has not yet mirrored the same magnitude of expansion, the divergence suggests underlying demand is building. If technical resistance breaks, this strength could translate into sharper upside moves.
The post XRP Price Analysis: Technical Structures Hint at Potential $4 Breakout appeared first on CoinCentral.


You May Also Like

Siren (SIREN) Plunges 26.7% in 24 Hours: On-Chain Data Reveals Troubling Pattern

AI giants Meta, Microsoft, NVIDIA stocks slip amid Iran threat, AI cryptos crash


