

HBAR price prints double bottom at $0.10, is a reversal forming?
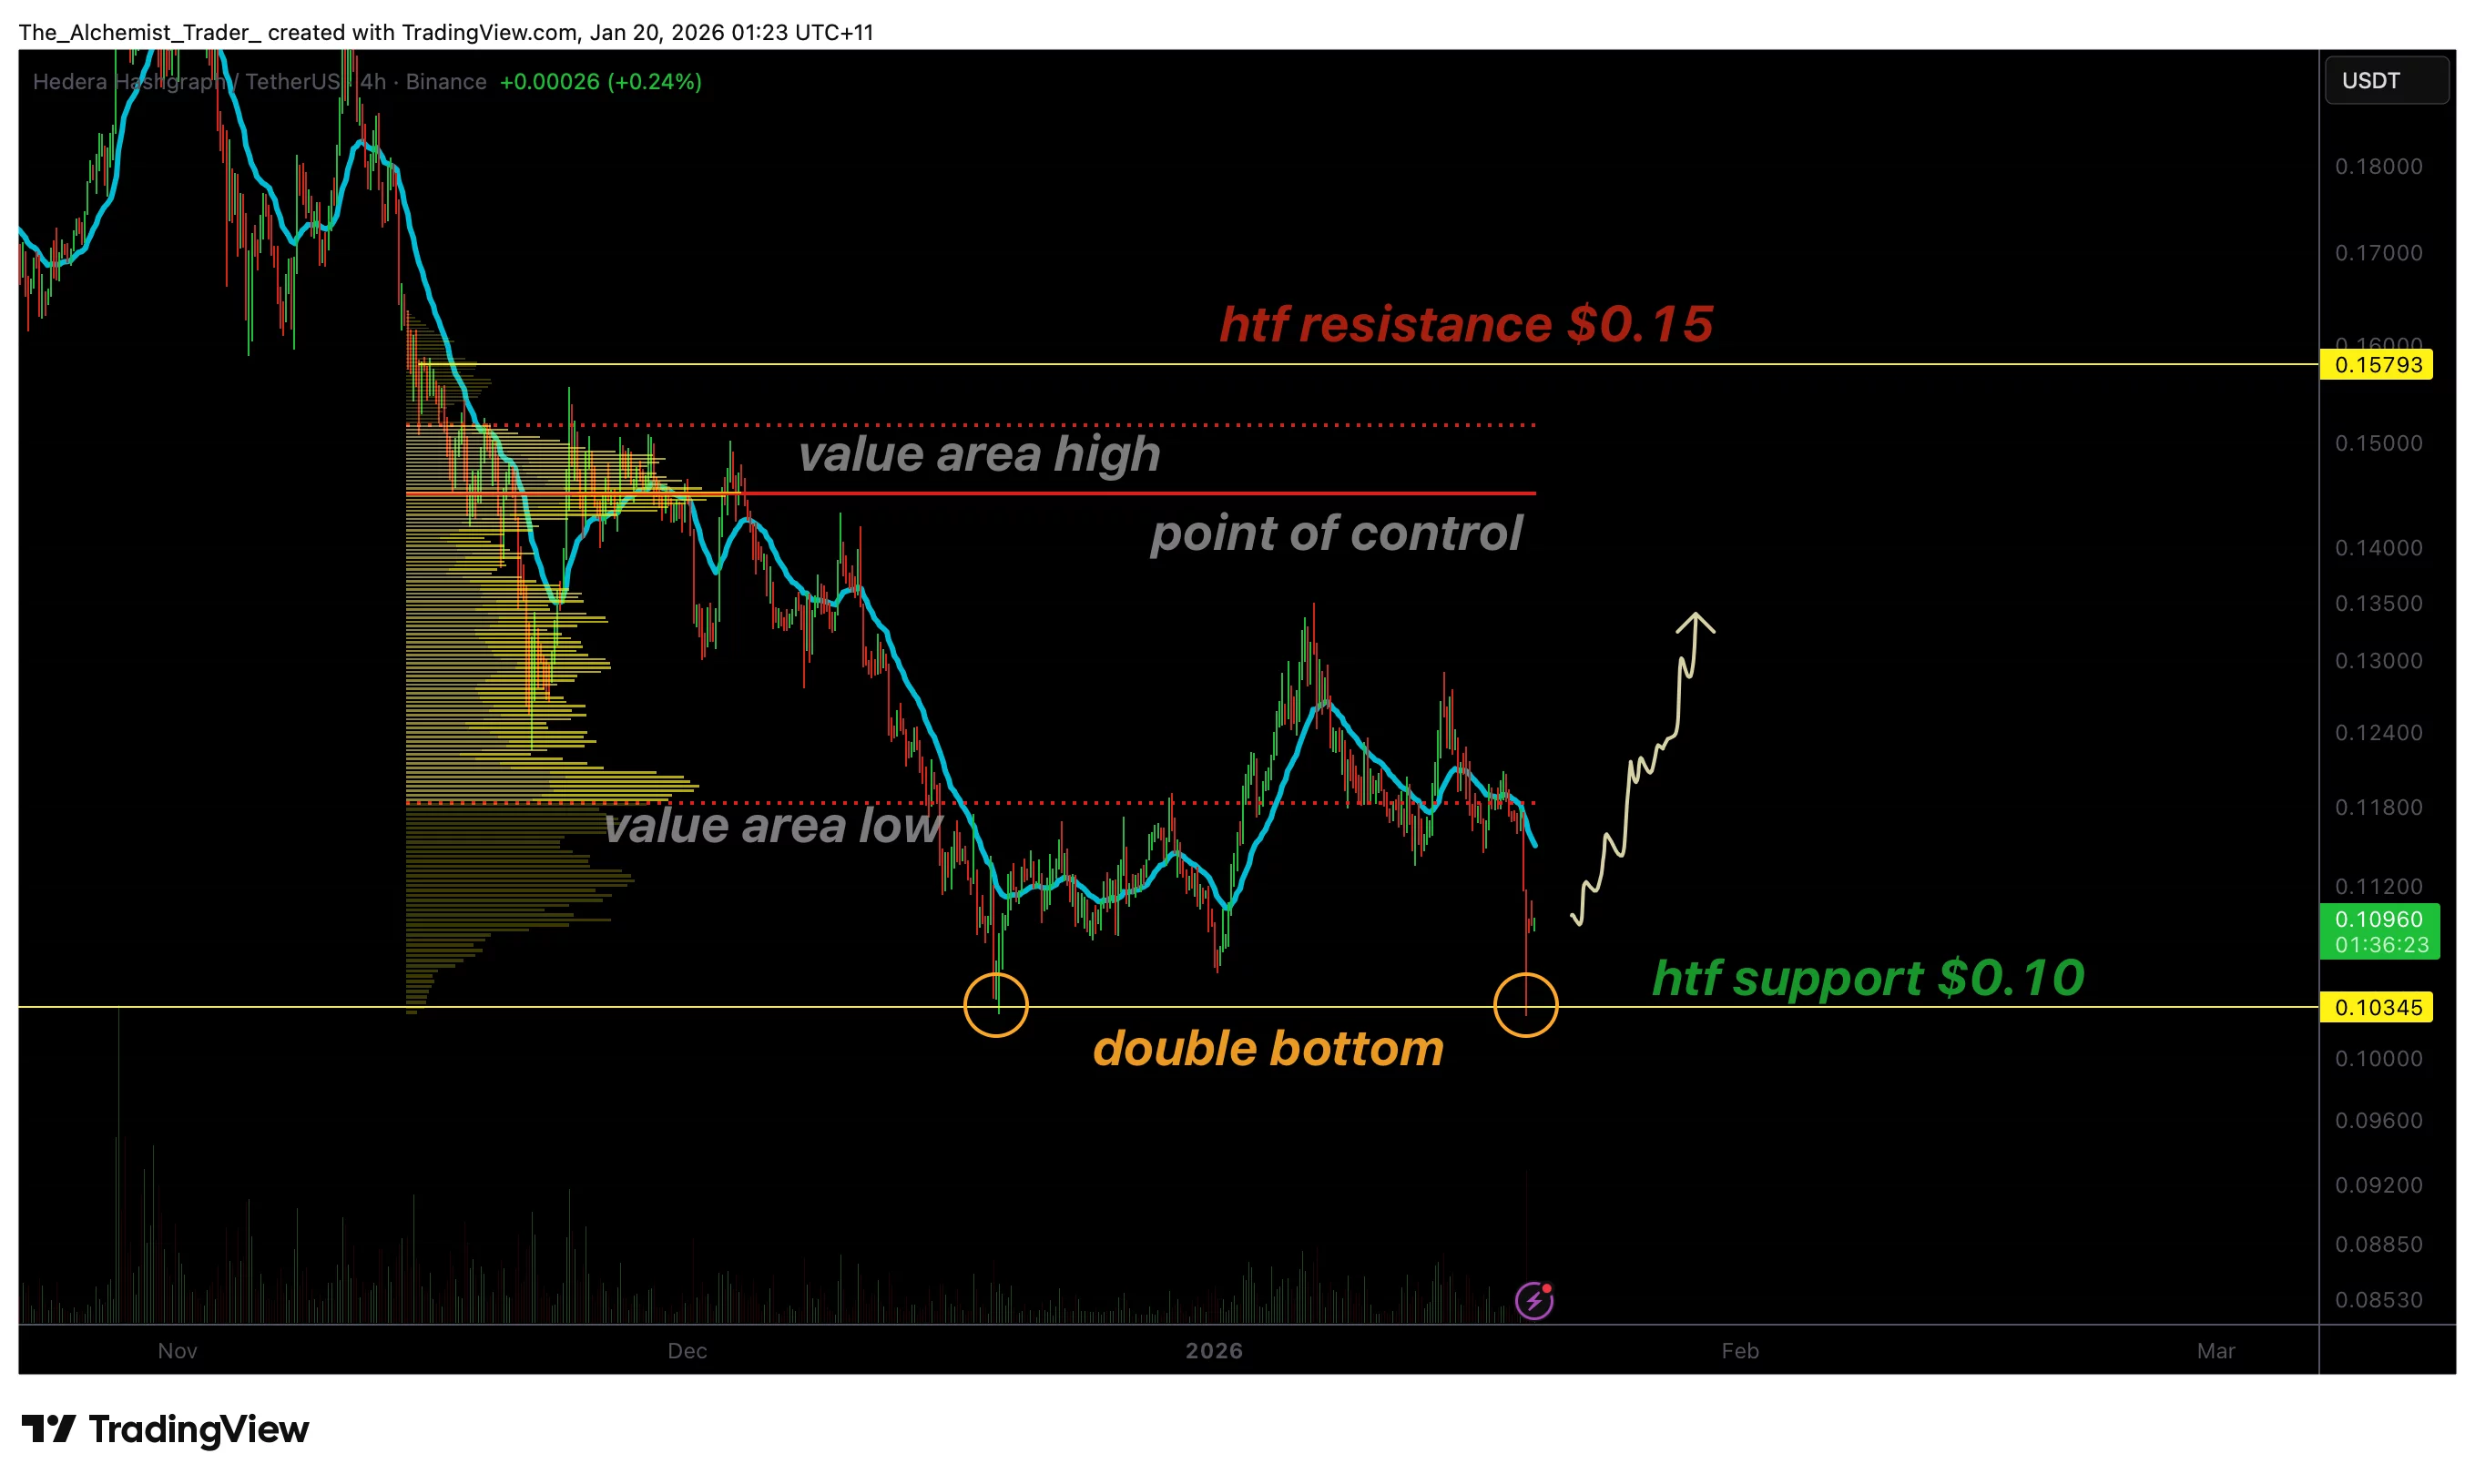
HBAR price is bouncing from $0.10 high-time-frame support, after a sharp drop, forming a potential double bottom that could signal a reversal if key resistance levels are reclaimed.
- HBAR defended $0.10 support, triggering a strong bounce
- Price structure is forming a double bottom reversal pattern
- A reclaim of value area low with volume is needed for confirmation
HBAR (HBAR) price is entering a technically important phase after price action rotated back into $0.10 high-time-frame support and printed a strong bounce. This move comes after the market gave back much of its prior rally, triggered by a breakdown below the value area low, which shifted short-term momentum bearish.
However, the pullback into support has now produced a structure resembling a double bottom, a common reversal pattern that can signal the end of a downtrend if confirmed. While the pattern is still developing and confirmation is not complete, the response at $0.10 suggests demand is present, and the market may be building a base for a rotation back toward higher levels.
HBAR price key technical points
- HBAR bounced strongly from $0.10 high-time-frame support
- Price action is forming a potential double bottom reversal pattern
- Reclaiming the value area low is required to confirm bullish continuation
HBAR’s recent weakness was driven by the loss of the value area low, which typically marks the lower boundary of accepted value in the market. When price breaks below this region and fails to reclaim it quickly, it often signals a shift toward lower value and increased selling pressure.
In this case, HBAR’s breakdown led to a corrective rotation that erased much of the prior upside move. Structurally, this type of drop can look bearish, but it becomes more meaningful when it tests a major high-time-frame level that has historically acted as demand.
That is what happened at $0.10. The market reached a key support zone and reacted strongly, which is often the first condition required for a reversal structure to form.
Double bottom formation and reversal potential
From a technical analysis perspective, a double bottom is considered a reversal pattern that often appears after a prolonged downtrend. It reflects a scenario where sellers fail to push price to new lows on the second test, while buyers begin stepping in more aggressively at the same support zone.
HBAR’s current structure is beginning to resemble this pattern because price has revisited the $0.10 area and bounced again, suggesting demand may be absorbing sell pressure. This is important because when double bottoms form at high-time-frame support, they can often lead to larger trend shifts once resistance breaks.
However, a double bottom is not confirmed simply by bouncing. Confirmation comes when price breaks above the neckline resistance and holds those levels with acceptance. That is the next step HBAR must complete for a reversal to solidify.
Value area low is the next resistance to reclaim
The next major level HBAR needs to reclaim is the value area low. This zone is important because it marks the threshold at which the market shifts from lower value back toward balance and strength.
If HBAR can break above the value area low and hold it on a closing basis, it would signal that buyers are regaining control and that the double bottom structure is transitioning from potential to confirmed.
This reclaim must be supported by bullish volume inflows. Breakouts without volume are vulnerable to failure and often lead to another rejection back toward support. A volume-backed reclaim would strengthen the reversal narrative and increase the probability of continuation toward higher resistance levels.
What to expect in the coming price action
HBAR is currently positioned at a critical support level where reversal conditions are starting to form. As long as price continues to hold $0.10 support, the probability remains elevated for the double bottom structure to develop further and rotate price back toward resistance.
The key confirmation level is the value area low. A successful reclaim with bullish volume would validate the reversal setup and increase the likelihood of a sustained rally. If HBAR fails to reclaim resistance, the market may remain range-bound and vulnerable to additional downside tests.


You May Also Like

Today’s Biggest Crypto Movers: Dogecoin Leads the Pack

RWA Boom Accelerates As Tokenized Assets Hit New Highs In Early 2026


