

Bitcoin Price Analysis: $89K Support Holds Amid Looming $93K Breakout
TLDR
- Bitcoin price holds key $89,000 support, preserving a higher-low daily structure.
- Filled CME gap near $88K eases downside pressure and shifts focus upward.
- New CME gap at $93K may act as a short-term upside price magnet.
- Inverse head and shoulders suggests a possible breakout if $91K is reclaimed.
Bitcoin(BTC) is consolidating near a pivotal zone as technical structures tighten across multiple timeframes. Analysts point to firm support near $89,000, while upside targets cluster around $93,000 and beyond. The current setup suggests that Bitcoin price is approaching a decisive phase driven by its structure, futures dynamics, and intraday patterns.
Bitcoin Price Holds Ascending Support on Daily Chart
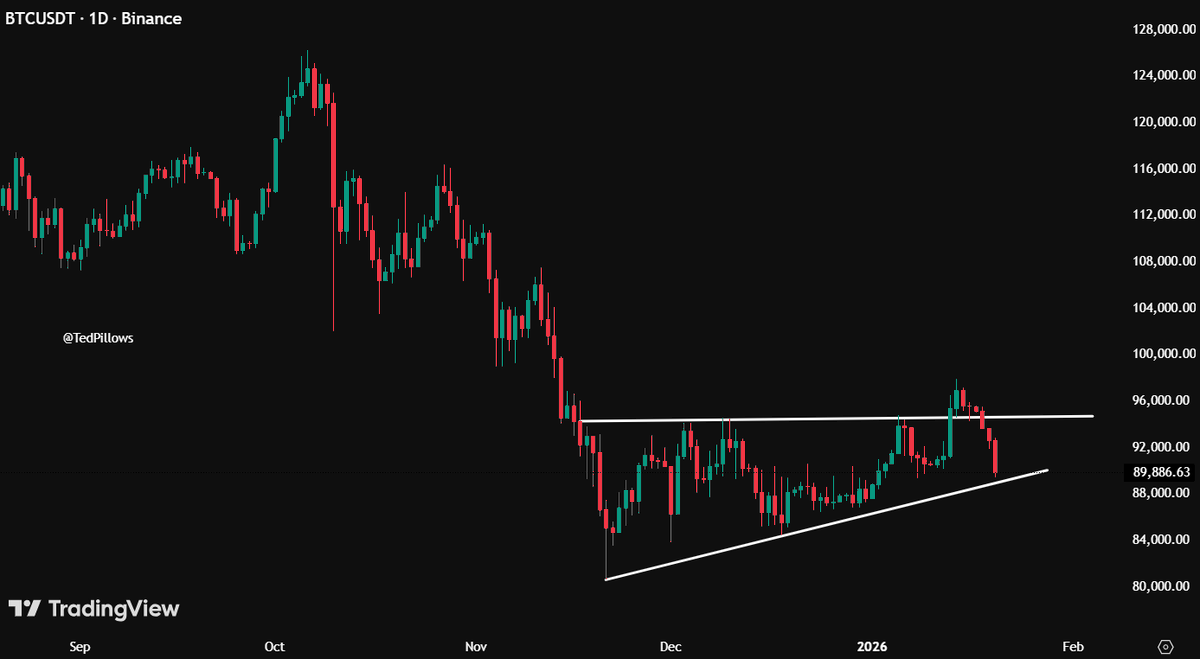
According to analyst Ted Pillows, the daily chart shows Bitcoin stabilizing after a sharp correction from October highs. Bitcoin price has formed a tightening range defined by rising support and horizontal resistance near $95,000–$96,000. This structure reflects volatility compression following heavy distribution.
Importantly, the $89,000 level remains the most important short-term pivot. This zone aligns closely with the ascending support line and has repeatedly absorbed selling pressure. Holding above it preserves a sequence of higher lows, keeping the daily structure corrective rather than bearish.
However, repeated rejections near resistance indicate limited bullish control. Buyers have defended support, but follow-through remains weak. As a result, Bitcoin price continues to trade within a make-or-break range, where structure depends on sustained buyer participation.
CME Gap Dynamics Shape Short-Term Bitcoin Price
Meanwhile, analyst Max Crypto focused on Bitcoin CME futures and gap behavior. Price recently moved lower to fill an open CME gap near $88,000. Such gaps often act as price magnets due to futures market inefficiencies.
With the lower gap now filled, immediate downside pressure has eased. Attention has shifted to a newly formed gap near $93,000, which may attract price if momentum stabilizes. The rebound from $88,000 suggests responsive buying interest at that level.

Despite this, BTC price remains below key resistance zones. Acceptance above $90,000–$91,000 is still required to confirm bullish intent. Until then, Bitcoin price may continue consolidating as traders assess post-gap conditions.
Intraday Pattern Signals Potential Bitcoin Price Reversal Attempt
According to analyst Don, the lower-timeframe chart reveals an inverse head and shoulders formation. This pattern developed after a sharp sell-off, marked by a clear left shoulder, a deeper head, and a higher right shoulder. Such structures often signal seller exhaustion.
Bitcoin price has rebounded from the head and is now testing the neckline near $90,000–$91,000. The higher low forming the right shoulder reflects improving buyer confidence. This behavior suggests bearish momentum may be weakening.

A confirmed break above the neckline would validate the pattern and project a move toward $93,000. Failure to reclaim that level could keep the market range-bound. Bitcoin price, therefore, remains sensitive to intraday confirmation signals.
The post Bitcoin Price Analysis: $89K Support Holds Amid Looming $93K Breakout appeared first on CoinCentral.


You May Also Like

Indian Rupee Gains Support from Higher Gold Import Tariffs, Says BNY

Micron and Sandisk Jump as Samsung Strike Threat Deepens Memory Chip Shortage


