

Sonic price eyes Fibonacci extension at $0.03, oversold signals build
Sonic price is trading towards the 1.618 Fibonacci extension near $0.03 as oversold conditions intensify, keeping bearish momentum firmly in control.
- Price trades at the 1.618 Fibonacci extension near $0.03, maintaining bearish momentum
- Low volume confirms trend continuation rather than accumulation
- Oversold conditions raise the risk of a sharp but corrective rebound if support holds
Sonic (S) price has remained under heavy selling pressure following a decisive breakdown from its prior high-timeframe structure. The token has struggled to attract bullish participation, with price continuing to trend lower in a controlled but persistent corrective move.
Despite approaching a key technical level, the broader market structure suggests that downside pressure may persist before any meaningful relief rally develops.
Sonic price key technical points
- $0.03 (1.618 Fibonacci extension) is the immediate inflection zone, price is stretched into a major extension level where a relief bounce can trigger if buyers step in.
- High-timeframe POC has flipped into resistance, as long as Sonic remains below this reclaimed-value threshold, rallies are likely to be corrective and sold into.
- Bearish structure + weak bullish volume favors continuation, consecutive lower highs/lows with low demand suggests downside risk remains, with deeper extension/support levels still in play.
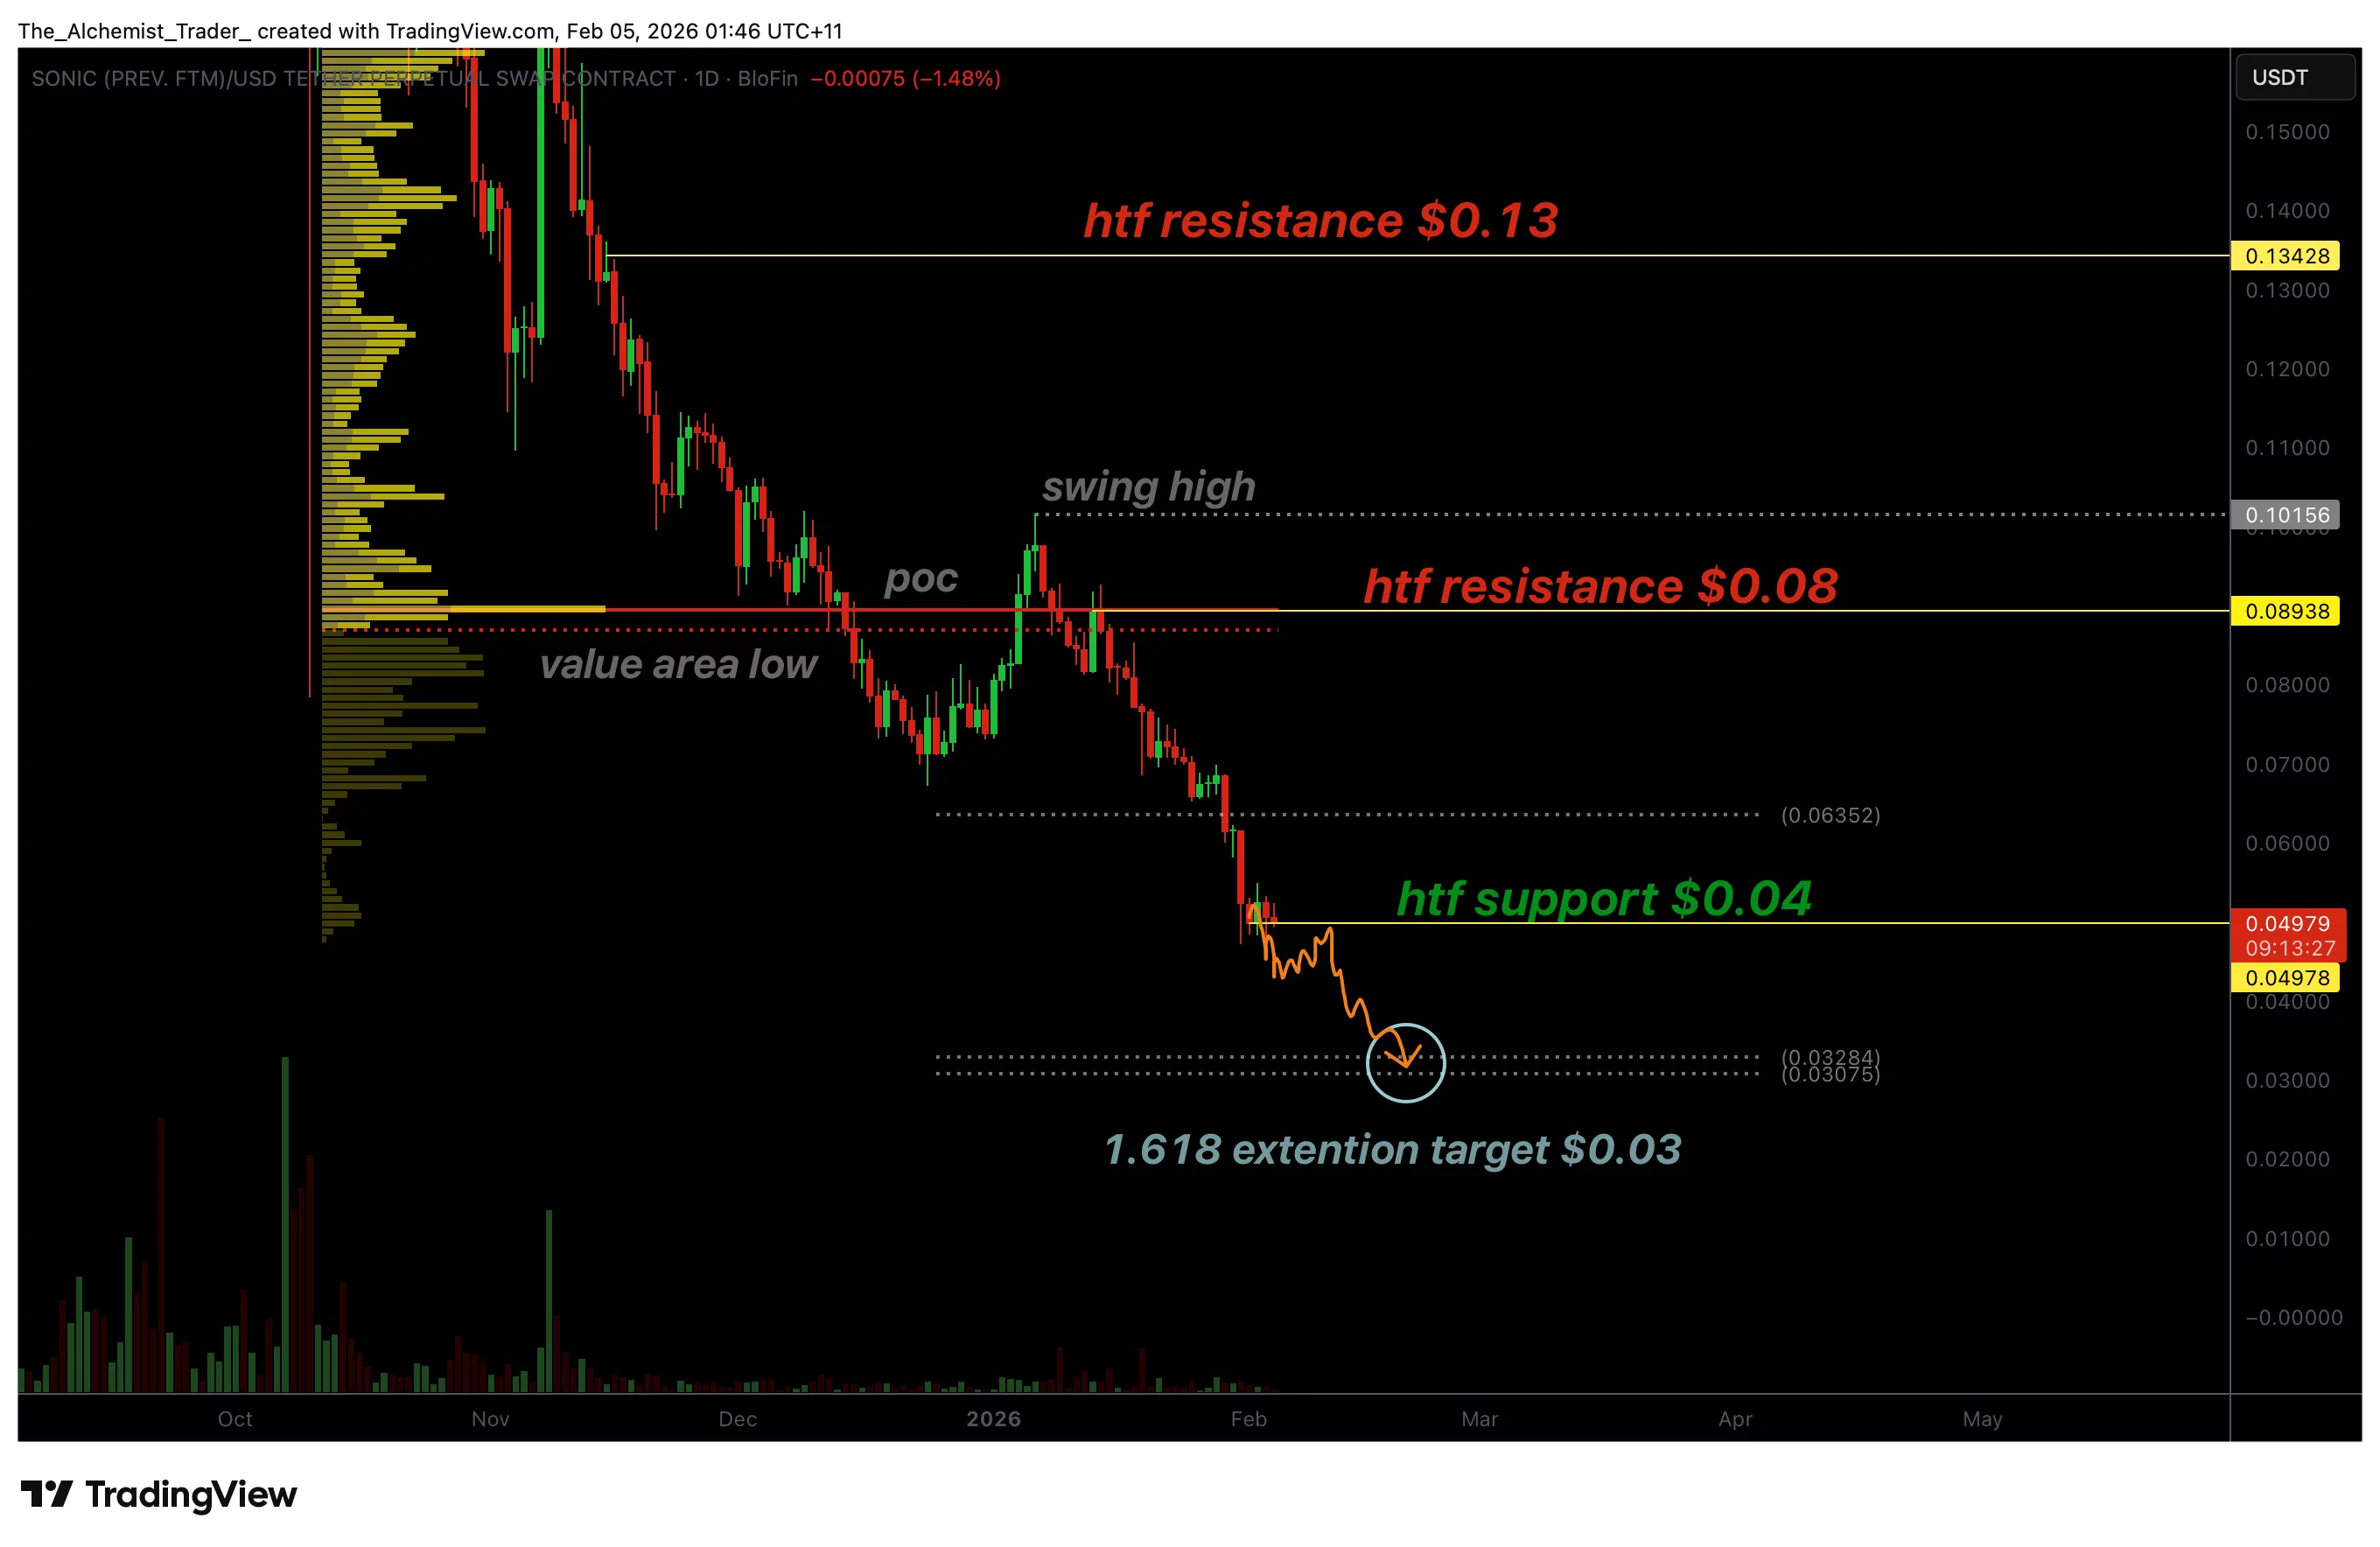
From a macro and high-timeframe perspective, Sonic continues to print a clear sequence of lower highs and lower lows. This structural weakness began after the most recent swing high was established, and the price failed to hold above key value levels. The loss of high-timeframe support marked a significant shift in market control, with sellers firmly dictating price action.
One of the most important technical developments has been the loss of the high-timeframe point of control (POC), which has now flipped into resistance. Each attempt to reclaim this level has been rejected, reinforcing the broader bearish bias.
As long as Sonic remains below this former value area, rallies are likely to be corrective rather than trend-reversing.
Low volume signals bearish continuation
Volume behavior continues to support the bearish outlook. The current decline has unfolded on consistently low volume, suggesting a lack of aggressive dip buying rather than capitulation. In trending markets, low-volume pullbacks often indicate continuation rather than exhaustion, especially when the price remains aligned with the dominant trend direction.
The initial reaction to the 1:1 Fibonacci extension provided only limited relief and failed to attract meaningful follow-through. This lack of demand highlights the absence of institutional or large-scale participation at current levels. Without a clear expansion in bullish volume, the probability favors further downside exploration before a sustainable base can form.
Fibonacci extensions define the downside targets
From a technical standpoint, the 1.618 Fibonacci extension at approximately $0.03 represents an important short-term inflection point. This level often acts as a magnet during strong trends, particularly when momentum remains one-sided. While price is currently interacting with this extension, historical behavior suggests that deeper tests are possible before any structural reversal occurs.
The next critical downside level sits at the 0.618 Fibonacci extension of the broader measured move within the downtrend. This zone represents the next major area of interest for potential stabilization. A reaction from this region could open the door for a corrective rally toward high-timeframe resistance, but only if confirmed by improving volume and momentum signals.
Oversold conditions raise the risk of a sharp rebound
Despite the dominant bearish trend, oversold indicators are beginning to flash caution for short sellers. Bollinger Bands analysis shows the price trading near the lower band, signaling stretched conditions. When the price reaches these outer bands during extended trends, reversals, if they occur, tend to be sharp and fast rather than gradual.
However, oversold conditions alone are not sufficient to confirm a trend reversal. In strong downtrends, markets can remain oversold for extended periods. Any bullish reaction from current levels would still be classified as a counter-trend move unless Sonic reclaims key resistance levels with strong volume confirmation.
Sonic price action: What to expect
Sonic is likely to remain under bearish pressure in the near term, with a continued focus on Fibonacci extension levels as price discovery unfolds. A test of deeper support zones remains possible before any sustained rebound materializes.
While oversold conditions increase the probability of a sharp relief rally, confirmation through bullish volume and structural reclaim levels will be essential before calling a meaningful trend reversal.


You May Also Like

Today’s Biggest Crypto Movers: Dogecoin Leads the Pack

RWA Boom Accelerates As Tokenized Assets Hit New Highs In Early 2026


