

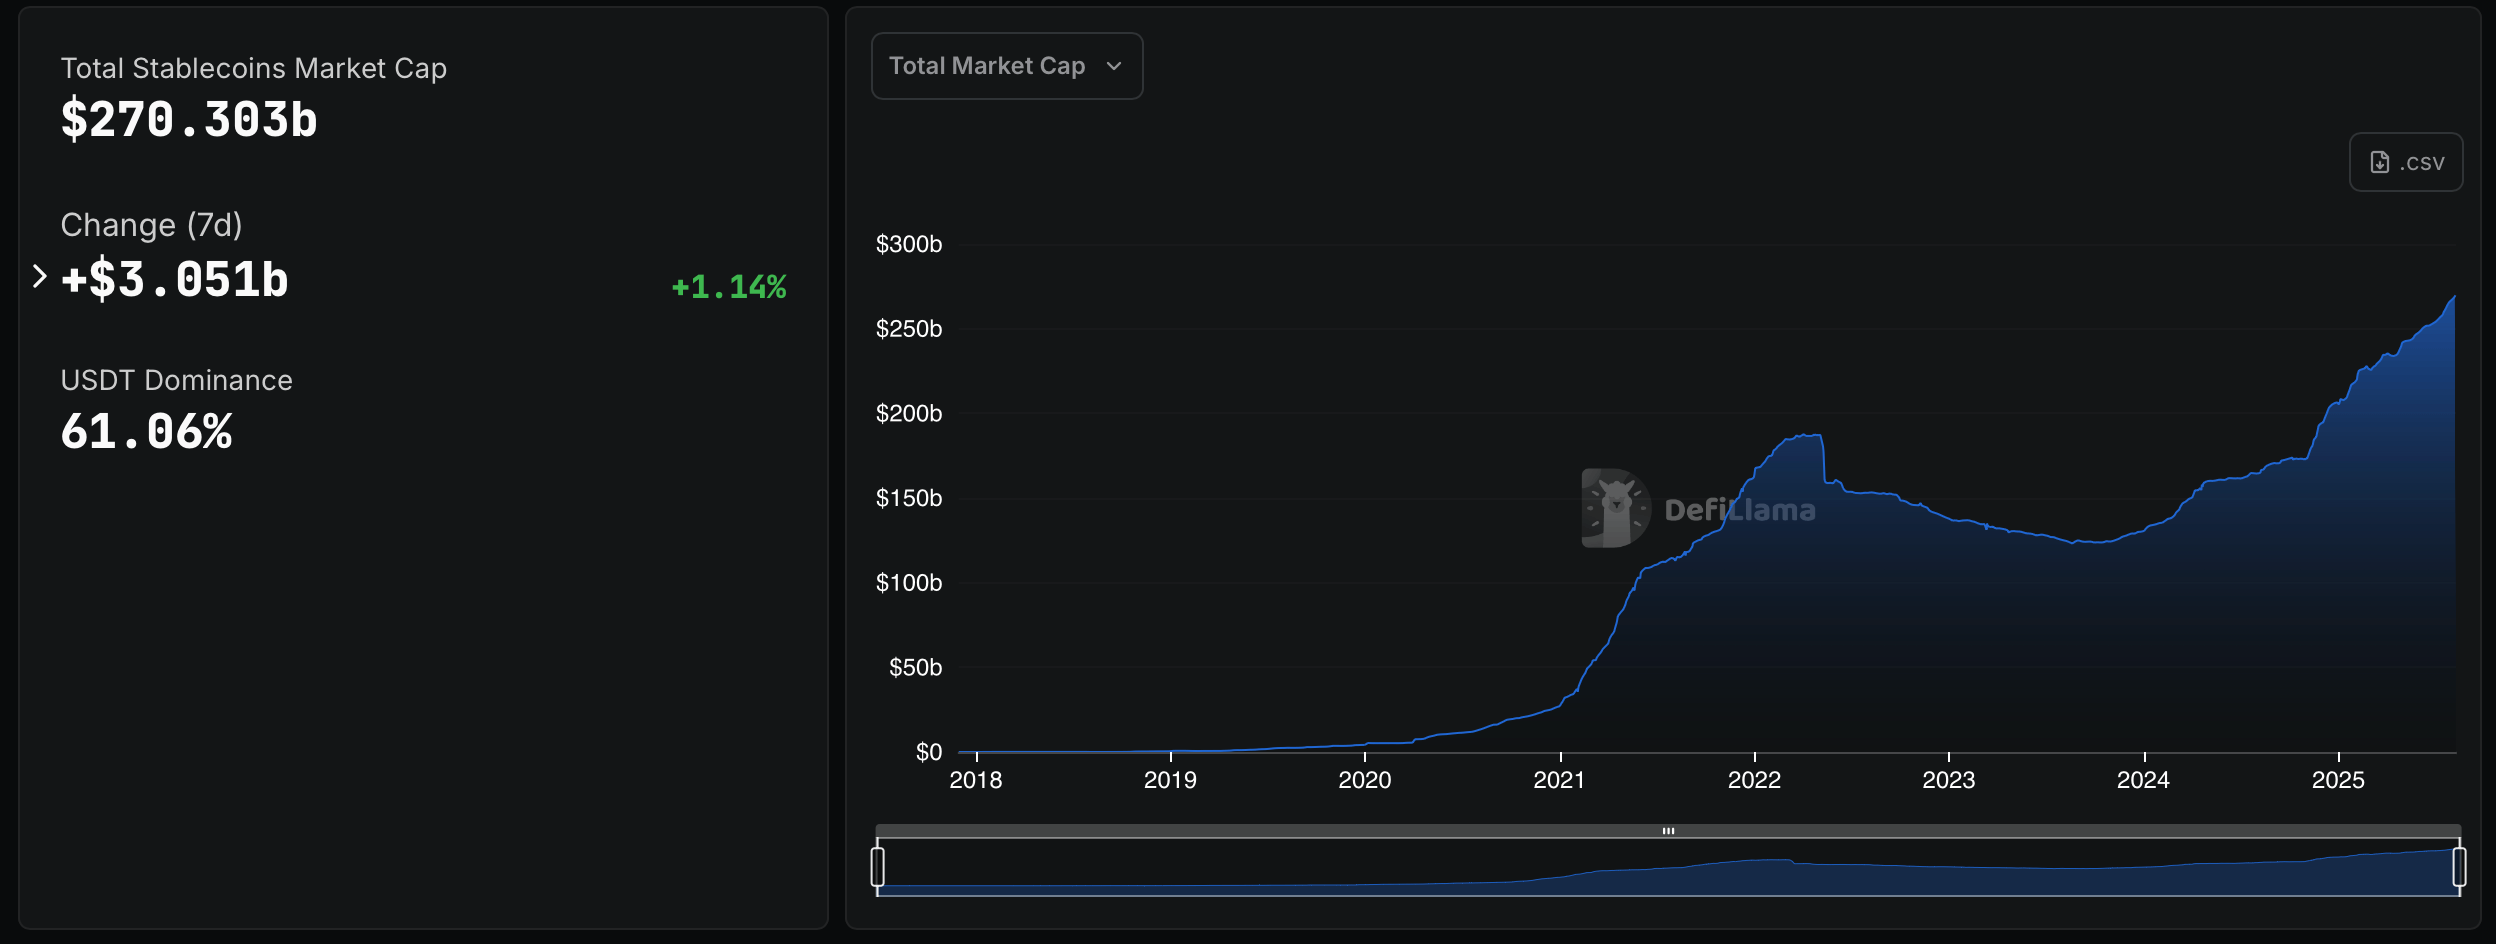
Stablecoin Float Surpasses $270 Billion, Setting a New High
The stablecoin market’s total value has surpassed $270 billion, marking a new milestone for the sector, according to stats collected by defillama.com and artemisanalytics.com.
Stablecoin Economy Climbs as Activity Broadens
Over the last seven days, aggregate stablecoin capitalization rose by $3.051 billion, a 1.14% gain, per defillama’s dashboard. The new total places the asset class within sight of its prior peak and extends a steady climb that carried through 2024 and 2025. The figure reflects circulating supply multiplied by price and focuses on dollar-pegged tokens.
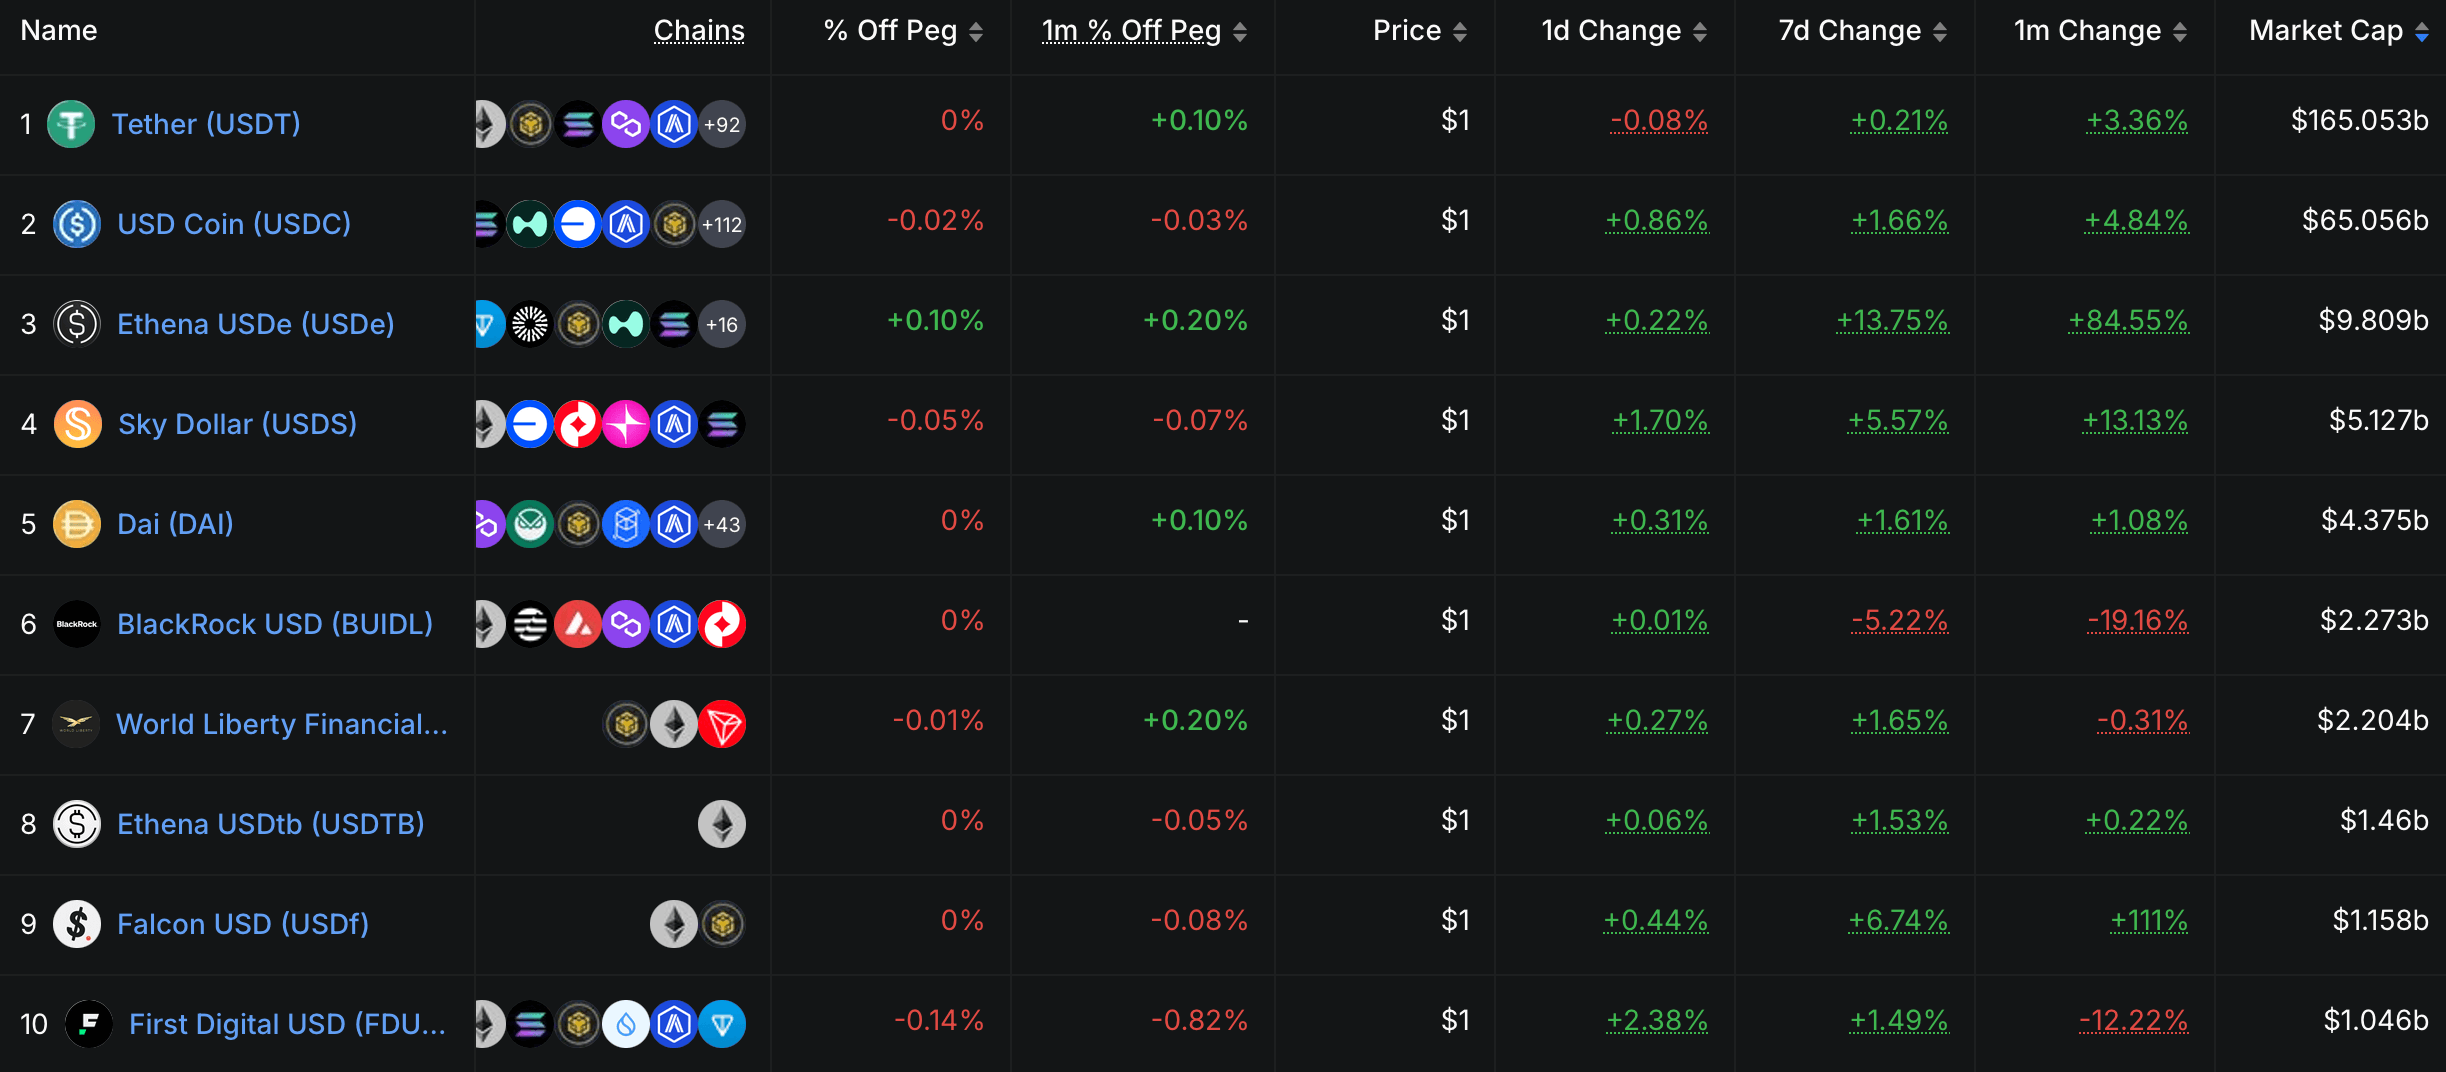
Presently, tether ( USDT) remains the market leader with 61.06% dominance. USDC is the second-largest component, while a mix of competitors, including Ethena’s USDe, Sky’s USDS and DAI, and Blackrock’s BUIDL, account for single-digit shares. Artemis Terminal’s market-share chart shows USDT holding a wide lead in 2025 and USDC’s portion trending higher this year.
 Source: Defillama.com
Activity remains broad. Artemis reports 42.8 million addresses interacted with stablecoins over the last month, down 15.2% from the prior 30 days, yet still near the high end of a five-year range. Address activity by chain has widened, with notable participation on BNB Chain, Tron, Base, Arbitrum, Solana, and OP Mainnet alongside Ethereum.
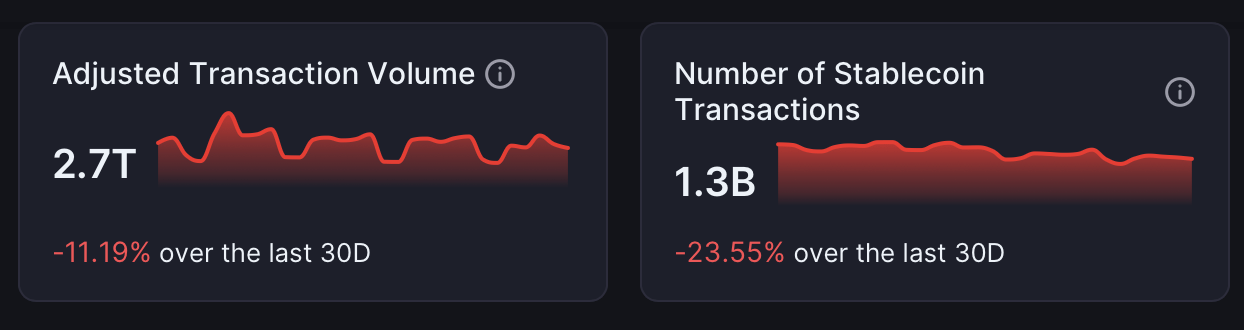
Turnover is heavy. Artemis figures estimate $2.7 trillion in adjusted stablecoin transfer volume over the last 30 days, even after an 11.19% month-over-month decline. The terminal’s multi-year view shows rolling adjusted volume in the $1 trillion range for much of 2024–2025, generally close to Visa’s level and well above Paypal and global remittance totals on a like-for-like basis.
 Source: Artemis Terminal
Transaction counts remain elevated at 1.3 billion over the last 30 days, down 23.55% from the previous period. That tally spans major networks and points to repeated use for payments, settlement, trading, and wallet funding across centralized and onchain venues.
Supply composition skews decisively to the U.S. dollar. Artemis’s currency breakdown shows issuance overwhelmingly in USD terms, with euro, pound, and other fiat pegs representing an extremely thin slice of aggregate supply. U.S. dollar tokens continue to anchor crypto pricing and collateral practices across major exchanges and lending platforms.
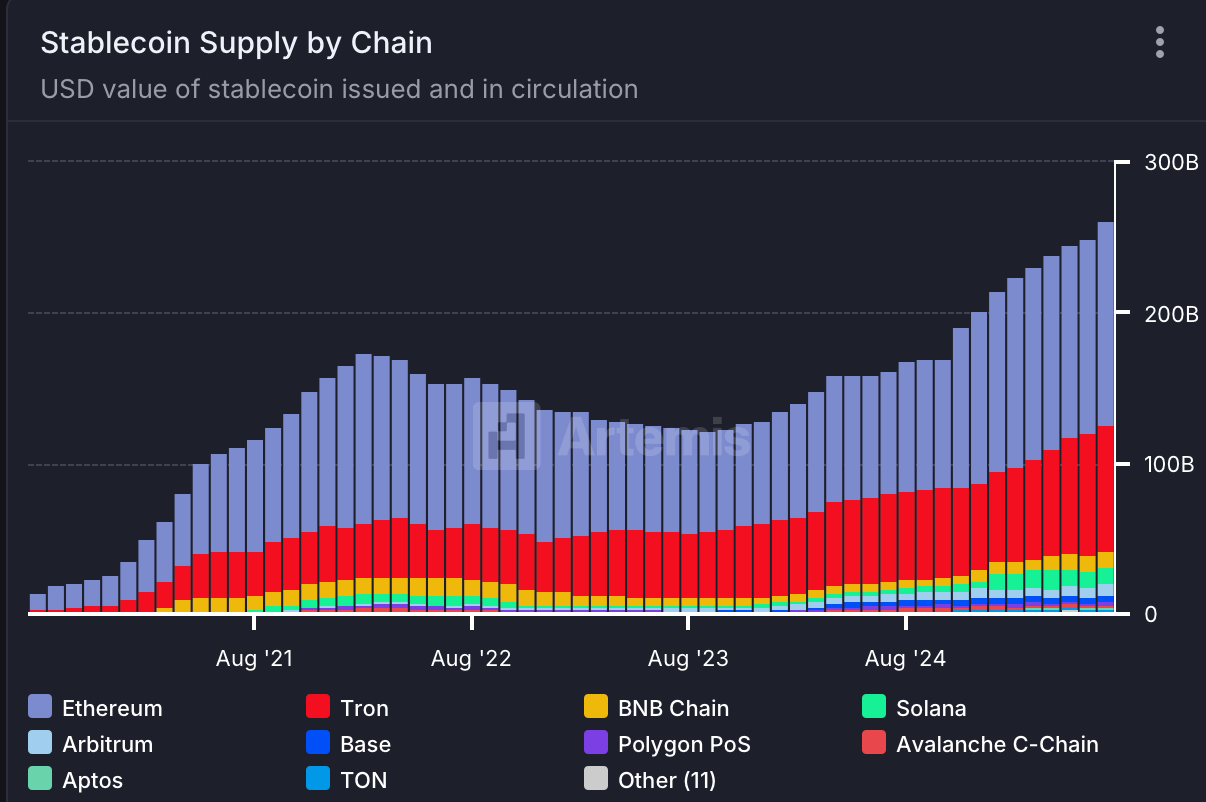
Chains matter. Artemis’s supply-by-chain chart shows Ethereum and Tron holding the largest outstanding balances to date, followed by BNB Chain, Solana, Base, and Arbitrum. A five-year view of net supply change ranks Ethereum first by absolute growth, with Tron second. Rising contributions from Base and Solana highlight additional venues for issuance and circulation.
 Source: Artemis Terminal
By token, the five-year net-change table places USDT far ahead in added supply, with USDC next. USDe and USDS contribute smaller but notable increases, while DAI and BUIDL add incremental amounts. The mix suggests incumbents still dominate issuance, even as new instruments target onchain cash management or delta-neutral yield strategies.
Regional flow is diversified. Using a timezone-based method on Ethereum and Solana, Artemis attributes a large share of adjusted transactions to North America and Asia, with Europe’s share lifting since 2024. Latin America, Southeast Asia, and Africa register smaller but very visible portions, signaling adoption by both retail and institutional users.
Active-address charts by token highlight USDT and USDC as primary drivers, with address counts and interactions posting new highs into 2025. Smaller issuers, including PYUSD and other niche pegs, show limited but steady engagement. The breadth of address participation points to stablecoins’ role as a crypto gateway and settlement medium.
The data from defillama.com and Artemis Terminal both point to a system that is larger, highly active, and geographically distributed. The $270.303 billion headline figure caps a period of consistent expansion, while liquidity concentrates in a handful of issuers and blockchains. The asset class functions as a bridge between trading venues, wallets, and traditional finance, including centralized exchanges and onchain protocols.
 Source: Defillama.com
As the total float reaches the $270 billion threshold, liquidity conditions on exchanges and in decentralized finance (DeFi) remain closely linked to dollar-pegged assets. Month-to-month rhythms vary, yet the combination of dominant issuers, multi-chain distribution, and deep address activity indicates persistent demand for tokenized dollars across trading, remittances, and settlement.
For context, Defillama lists total stablecoin market cap history climbing from under $10 billion in 2019 to above $250 billion by late 2021, followed by a drawdown and a gradual recovery into 2025. Today’s $270.303 billion reading places the float at a new high for the period.


You May Also Like

Thomas Massie spotted strumming a banjo with self-proclaimed antisemite: report

Q2 Market Insights: Bitcoin regains dominance in risk-averse environment, ETFs remain critical to market structure


