Cardano (ADA) Eyes $0.40–$1.32 Rally as Key Support Zone Sparks Accumulation
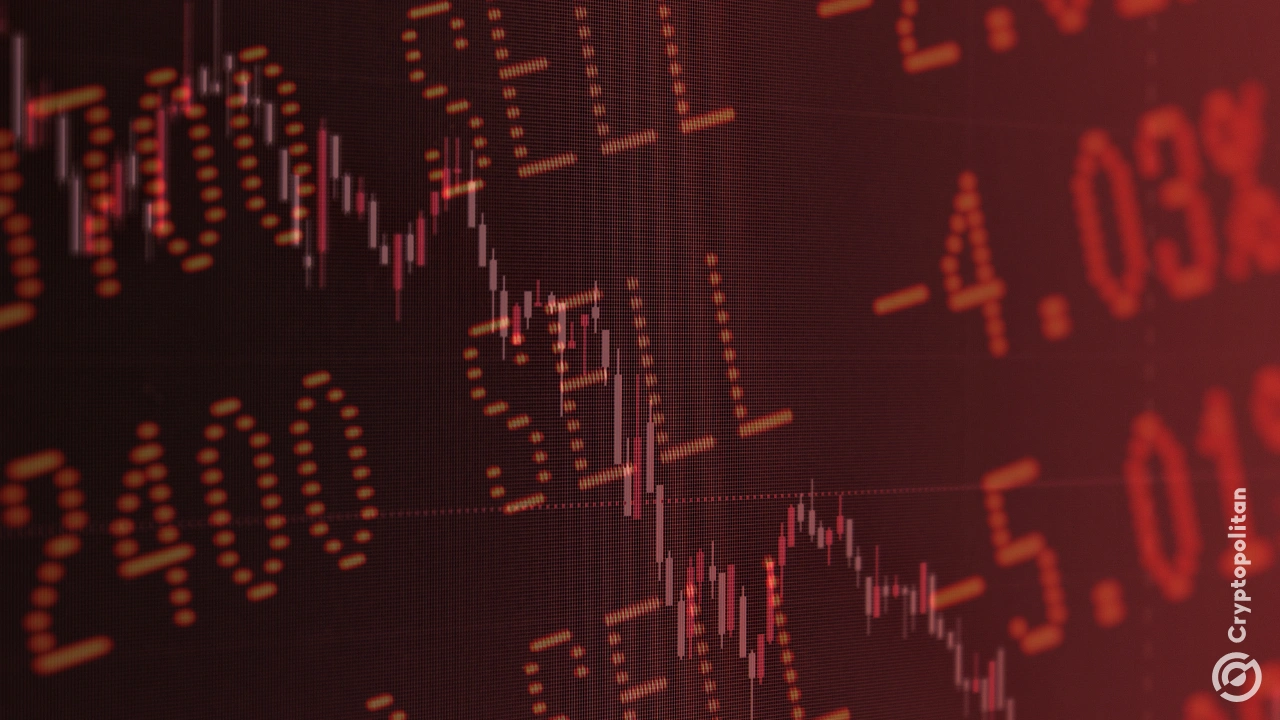
Cardano (ADA) is currently testing a major support zone, which is a price level that has historically seen significant rallies. At press time, Cardano is trading at $0.2499 as of February 6, with a trading volume of $2.93 billion within the last 24 hours and a market capitalization of $9.09 billion, having experienced a 11.28% dip over the last 24 hours and a 22.31% drop within the last week.
Cardano Approaches Critical Support Rally
Crypto analyst Crypto Patel noted in his analysis on February 6, 2026, that ADA is approaching the same support zone, which led to a 2100% price rise during the 2021 bull run.
This zone, between $0.14 and $0.18, may be an area of strong accumulation before the next potential rally, according to Patel. “Every time this zone has been touched, we have seen huge rallies, including a 600% rally in 2024.”
Cardano Weekly Momentum Slips Further
As per the technical indicators, ADA is still under immense pressure. The Relative Strength Index (RSI) of ADA is at a level of 27.63, indicating that it is trading in the oversold zone. The price of ADA is trading much lower compared to the major moving averages.
The 20-week simple moving average is at $0.6436, the 50-week simple moving average is at $0.6113, the 100-week simple moving average is at $0.5155, and the 200-week simple moving average is at $0.4884. This shows a strong bearish trend, indicating weakness in the market.
Further bearish signs are indicated on the MACD chart. The MACD line is at -0.0170, which is below the signal line at -0.1128. The histogram is negative at -0.0957. It is indicated that until the MACD line begins to flatten or rise, the selling pressure is likely to persist.
Also Read | Solana Liquidity Boost: Multiliquid & Metalayer Launch Instant RWA Redemption Backstop
Cardano Signals Potential Next Rally
However, despite the decline, history and analyst insights point to a possible accumulation phase. Patel states that ADA can follow historical patterns, which can see the price target between $0.40 to $1.32, or even $3.10 if a full-cycle extension is achieved. The point of invalidation for this is if the price closes below $0.10 per week.
Investors should remain cautious and keep an eye on price movements. Low sentiment is a time for long-term buyers to accumulate, setting up a future rally.
Considering the parabolic run-ups Cardano has experienced from these price levels in the past, Cardano could be setting up for the next big move, making this an important time for ADA investors.
Also Read | XRPL Adds Institutional Lending and Privacy Tools in Ripple’s 2026 Roadmap


You May Also Like
Crypto mining stocks suffer brutal quarterly slump

Southwestern National Bank Introduces New Brand and Trade Name