Cardano Under Pressure: ADA Tests Critical $0.249 Support Zone
Cardano (ADA) remains under sustained bearish pressure, with price action pointing toward a critical support test near the $0.25 region.
Cardano is a layer one (L1) blockchain network created to provide scalability, sustainability, and primarily peer-reviewed development to serve as a long-term smart contract platform.
It continues to have solid fundamentals, but due to weakness in the broader market, ADA has had difficulties returning to bullish price action. At press time, the coin is trading at $0.2629 with a decline of 3.43% over the past 24 hours.
Chart Signals Bearish Continuation
According to the data from TradingView, ADA is showing a strongly bearish view since it continues to trade much below both the 50-day and 200-day moving averages, indicating the strength of this firmly established downtrend.
The rejection of price near or at the resistance zone of $0.36 – $0.40 shows the amount of selling pressure that exists in this zone, that sellers are very much in control.
In addition, with the continued decline in On-Balance Volume (OBV), this supports the notion that ADA will continue to break down as we see no accumulation (only distribution).
Although there may have been some small upswings (bounces) in the past, they occurred with no volume and should be viewed as short-term relief periods and not reversals of trend until ADA has cleared the significant moving averages above.
ADA is still under significant bearish pressure, with price action indicating that the next critical support test will likely be in the $0.25 area.
Also Read: Cardano (ADA) Eyes $0.40–$1.32 Rally as Key Support Zone Sparks Accumulation
Analyst Shows Weekly Support Levels
Ali Charts, a crypto analyst, tweeted that Cardano’s weekly structure has 3 significant support zones at $0.249, $0.115, and $0.053.
The first support at $0.249 is very important as aligned closely to the current price action, and if it breaks below this range, we would expect an increase in selling volume and a move towards the lowest historical support levels. If it holds above $0.249, then there could be some brief price stabilization; however, this would not imply a trend reversal.
All in all, Cardano continues to see bearish technicals per daily/weekly indicators and the possibility for further downside risk. The $0.249 support area now becomes an important line in the sand for bulls to defend.
Until ADA breaks above key resistance levels with strong buying volume, we can expect prices to remain under downward pressure in the near future, and therefore, traders should remain cautious.
Also Read: Cardano (ADA) Technical Outlook Shows Potential Move Up to $0.53584


You May Also Like

Robotics Automation Prototyping: Engineering Kinetic Agility into End-Effectors
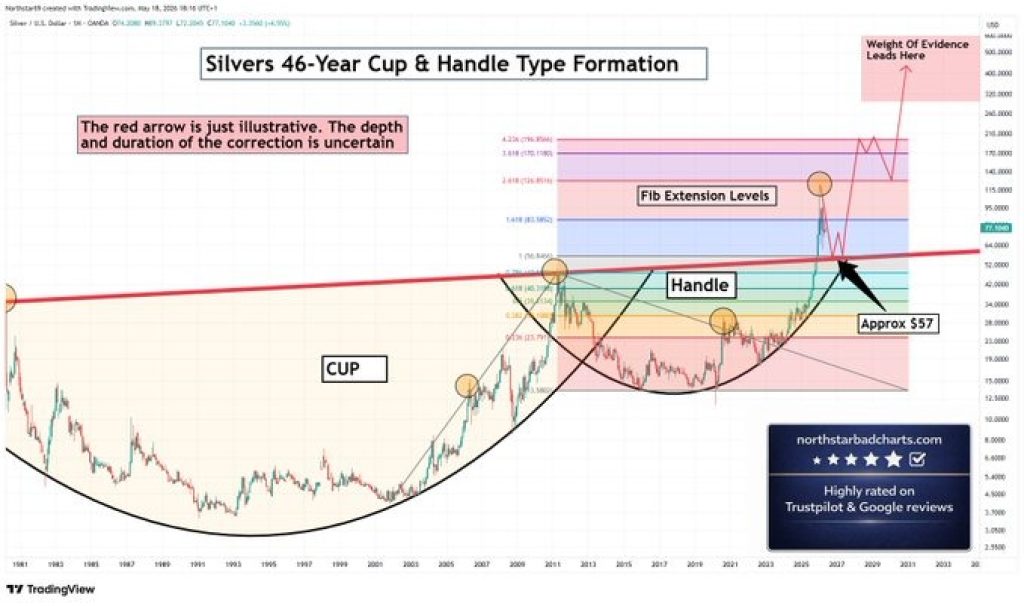
Silver Price Prediction: Cup and Handle Points to $196 – Why the Correction Was Always Part of the Plan