

XRP price enters stop-loss phase after SOPR breaks below 1.0 for the first time since 2022
XRP price is further depressing into a loss-driven phase as selling picks up speed in both the spot and derivatives markets.
- XRP has entered a stop-loss phase as on-chain profitability turns negative.
- Recent selling pressure is driven mainly by smaller holders, not whales.
- Technical structure continues to favor downside despite rising trading activity.
XRP was trading at $1.44 at press time, down about 1% in the last day. The price has dropped by roughly 10% in the past week, 30% in the last month, and over 40% in the last year. Since its peak of $3.65 in July 2025, XRP has experienced a significant decline, losing nearly 60% of its value.
Despite the price slide, activity has picked up. Spot trading volume climbed 22% in the last 24 hours to $3.45 billion, suggesting active re-positioning rather than quiet drift. Derivatives data paints a more cautious picture.
According to CoinGlass data, XRP (XRP) futures volume rose 12% to $5.66 billion, while open interest slipped slightly by 0.17% to $2.50 billion, pointing to traders closing exposure rather than adding fresh leverage.
On-chain data points to stop-loss driven selling
On-chain signals suggest the recent move lower is being driven less by whales and more by holders exiting at a loss. In a Feb. 9 X post, Glassnode noted that XRP has fallen below the aggregate cost basis of its holders, pushing the market into what they described as a “stop-loss phase.”
The firm noted that the 7-day EMA of Spent Output Profit Ratio has dropped from 1.16 in July 2025 to 0.96, its first sustained move below 1.0 since 2022. When SOPR falls under this level, it means coins are being sold at a loss on average.
On-chain profitability has flipped negative, and realized losses are now outweighing realized gains. Glassnode compared the current setup to the September 2021 to May 2022 period, when XRP spent months consolidating after SOPR slipped below 1.0.
Data from CryptoQuant adds another layer. Analyst PelinayPA noted that whale-to-exchange flow remains near historical lows, even as price has dropped to around $1.42–$1.45.
During the July 2025 rally, whale selling surged near the top. That pattern has not appeared this time. Rather, smaller holders have been the main source of selling pressure recently, and big players seem to be holding off on distributing until prices have increased.
This type of arrangement has historically resulted in sideways or slightly lower price action before short upward spikes draw whale selling.
XRP price technical analysis
The daily chart continues to form lower highs, leaving the broader downside bias in place despite short-lived rebound attempts. Both the 50-day and 100-day moving averages, which have begun to decline and are currently serving as overhead resistance, are limiting the upside momentum.
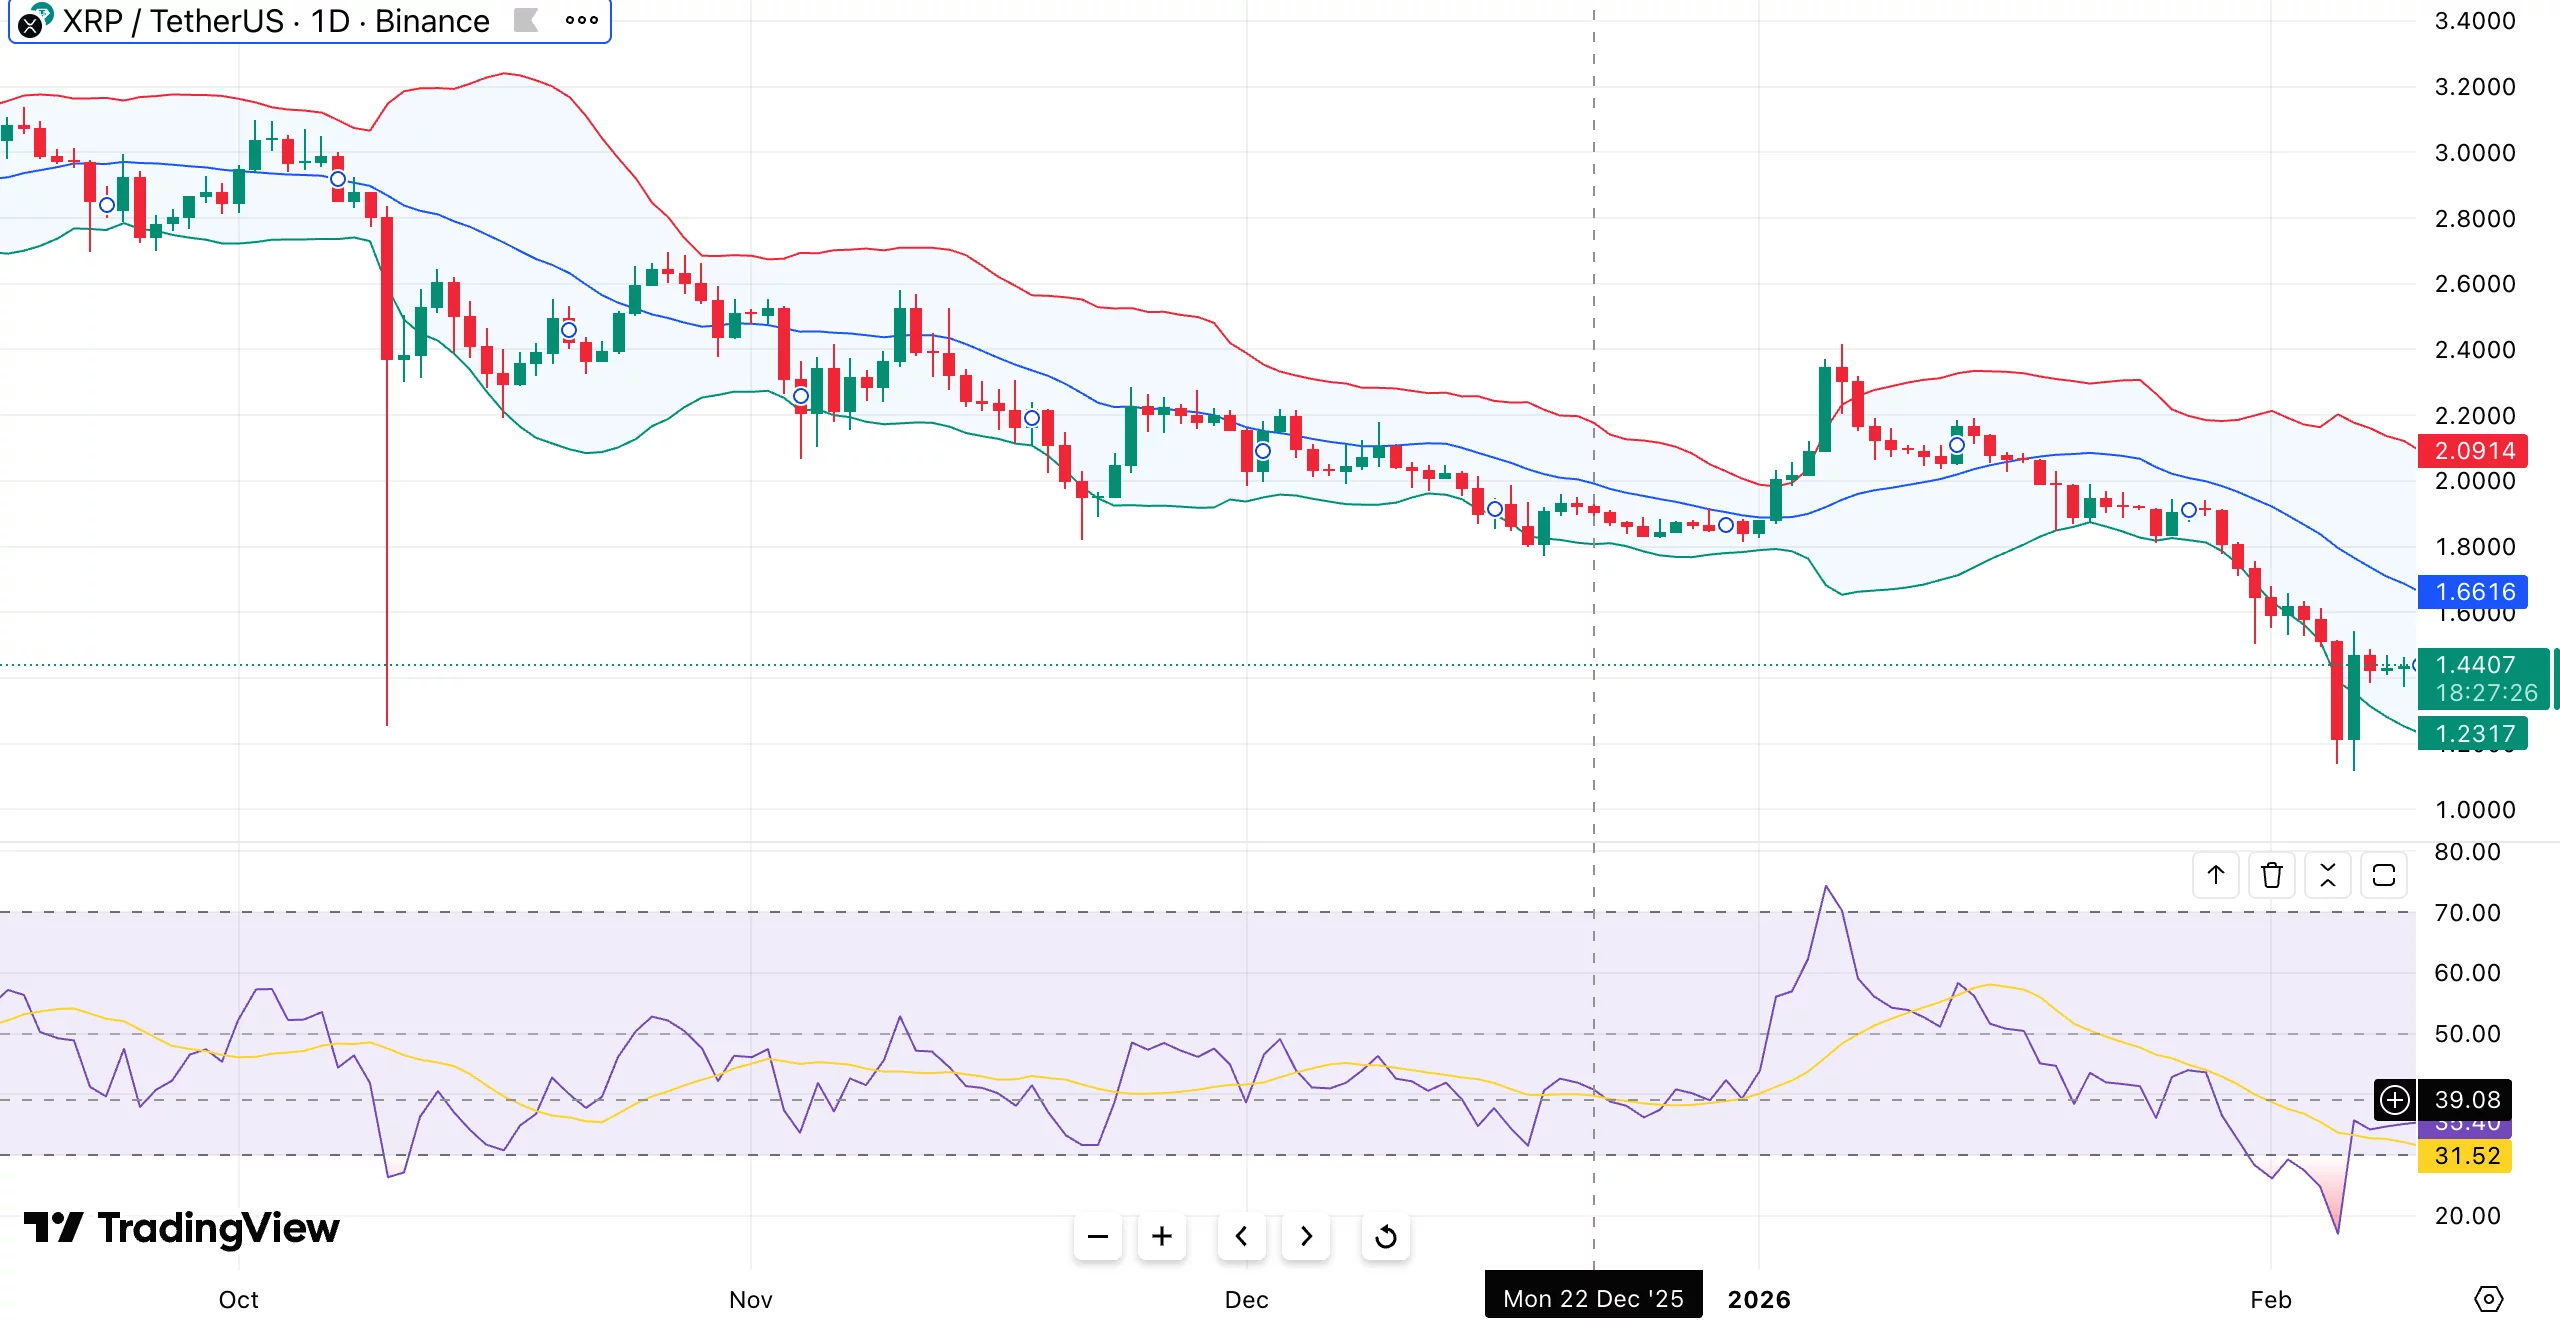
After multiple unsuccessful attempts to stay above the mid-band, the price has been pushed toward the lower Bollinger Band, indicating that volatility is settling to the downside rather than creating a stable range.
There is currently no confirmed bullish divergence, and the daily relative strength index is still below neutral, indicating weak momentum.
Volume behavior lends more credence to this view. Although there hasn’t been a noticeable capitulation spike, increased selling has been observed on down days, suggesting steady stop-loss activity as opposed to panic selling.
Previously a strong support area, the $1.45–$1.50 range is now being retested with a notably weaker buyer response. Attempts to reclaim previous breakdown levels were quickly rejected, indicating strong overhead supply.
If selling pressure remains high, the price could move toward the $1.35–$1.30 support zone, where buyers had stepped in during late 2024. A daily close below $1.30 would make a deeper decline toward $1.20 more likely, a level where longer-term demand has previously been seen.


You May Also Like

Covéa Chooses Shift Technology as Strategic Partner for Fraud and Risk Management

Liventus Acquires Tamarack to Become the Most Comprehensive Technology Partner for Equipment Finance Organizations

Bitcoin Liquidations Dethroned? A Tokenized Bet Just Posted Crypto’s Biggest Loss


