Bitcoin Retail Transfers Collapse: Lowest Since Bull Market Peak In 2021
Bitcoin is navigating a critical juncture after reaching a new all-time high of $124,500 last week before quickly retreating. The price is now searching for support, with volatility intensifying and traders debating whether this is the start of a deeper correction or simply a healthy consolidation phase before continuation. Some analysts remain optimistic, seeing this pullback as a natural reset in an overheated market, while others argue that momentum is fading as bearish signals emerge.
Adding weight to the discussion, CryptoQuant analyst Axel Adler highlighted a key trend in retail participation. The share of retail transfers in the $0–$10K range within Bitcoin’s total USD turnover has been steadily declining throughout this cycle. From a peak of 2.7%, the share has now dropped to just 0.6%.
Historically, such declines in retail participation have coincided with the later stages of bull cycles. This dynamic raises questions about whether the current phase marks a cooling of retail enthusiasm at a critical time for Bitcoin, as institutional and long-term holders dominate market structure.
Bitcoin Retail Activity Declines as Market Cools
According to CryptoQuant analyst Axel Adler, while the share of retail activity in Bitcoin’s network has dropped sharply, in absolute terms it still remains significant. Retail transfers in the $0–$10K range amount to over $400 million per day, but this represents only 0.6% of total USD turnover across the network. This shrinking share highlights a clear trend: while small investors are still active, their relative impact on overall market flows is diminishing.
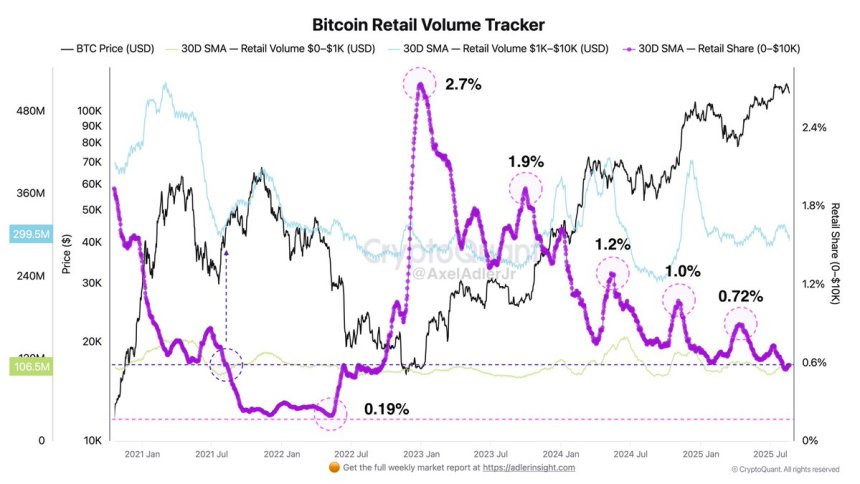
Adler notes that this cooling of retail demand was also observed in autumn 2021, at the peak of the previous cycle. At that time, the retail share fell to a historic low of just 0.19%, coinciding with overheated market conditions and marking the final stages of that bull cycle. The current decline in retail participation mirrors that pattern, suggesting that the market could be approaching a similar late-cycle environment.
This dynamic is important because retail investors have traditionally been a strong driver of momentum during bull markets. With their reduced influence, institutional flows, long-term holders, and treasury strategies now play an even greater role in shaping market direction. The coming weeks will be critical as altcoins, led by Ethereum, show renewed strength. ETH is approaching its 2021 all-time high, and many analysts believe that its performance could dictate the broader crypto market’s next move.
If retail demand continues to fade while institutional accumulation grows, Bitcoin may consolidate further, while capital rotation toward altcoins gains momentum.
Bulls Defend Key Demand LevelThe 8-hour chart shows Bitcoin (BTC) under pressure as it trades near $113,400, struggling to hold above its 200-day moving average (red line), currently aligned around $113,416. This level has become a critical support zone after BTC failed to sustain momentum above the $123,217 resistance, which has acted as a clear rejection point multiple times this cycle.
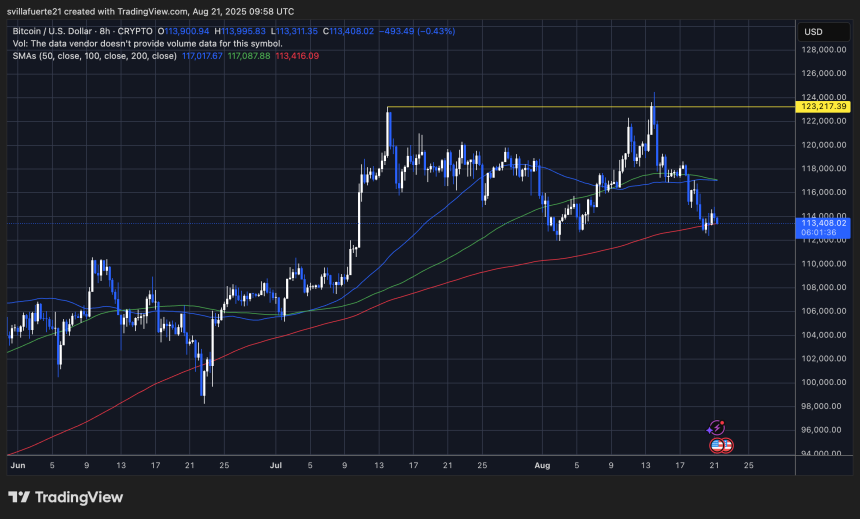
Shorter-term moving averages highlight the bearish momentum. The 50-day SMA (blue) at $117,017 and the 100-day SMA (green) at $117,087 are both trending above the current price, creating overhead resistance. The breakdown below these averages confirms a weakening trend, with BTC struggling to regain lost ground. Price action also shows a sequence of lower highs and lower lows since the rejection at the $124K zone, reinforcing bearish short-term sentiment.
For bulls, reclaiming the 100-day SMA near $117K would be key to reversing momentum and reattempting a push toward the $120K–$123K range. Failure to hold the 200-day SMA risks accelerating downside, potentially opening the path toward $110K, a major psychological level.
Featured image from Dall-E, chart from TradingView


You May Also Like

US-Iran Ceasefire at Risk as Bitcoin Rallies on War Relief
Trump admin tables new crypto 401(k) plans. President's 'Wall Street buddies' are the winners, critics say