

Ethereum Price Analysis: ETH Price is at Risk of $1,800 Test After Derivatives Wipe-Out

The post Ethereum Price Analysis: ETH Price is at Risk of $1,800 Test After Derivatives Wipe-Out appeared first on Coinpedia Fintech News
Ethereum price is entering a critical phase after losing a major weekly support level near $2,360, triggering a wave of liquidations across derivatives markets and raising the probability of a deeper correction.
ETH is now trading near $1,977 following a high-volume breakdown that confirms a lower-high structure on the weekly chart. At the same time, open interest across exchanges has collapsed by nearly 50%, active addresses have declined since early February, and exchange reserves have begun ticking higher after months of steady outflows.
The combination suggests this is more than a routine pullback. Momentum has shifted, participation is cooling, and short-term risk remains skewed to the downside unless bulls quickly reclaim lost levels.
Open Interest Collapse Signals Aggressive Long Liquidations
One of the clearest signals behind the move is the sharp decline in open interest. Ethereum open interest has fallen from approximately $23 billion to $11.3 billion, marking a near 50% wipeout. This indicates large-scale long liquidations and forced deleveraging across exchanges and a derivatives-driven flush rather than a steady spot distribution.
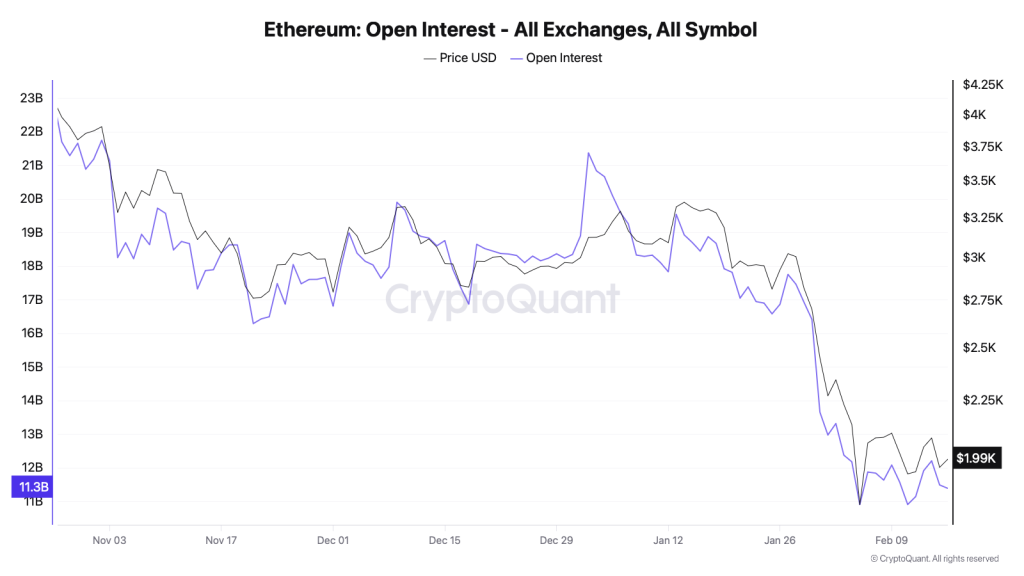
When open interest collapses this quickly, it typically reflects liquidation cascades rather than gradual positioning changes. However, this also introduces nuance. Such resets often occur near local bottoms because excessive leverage gets cleared. For downside continuation to accelerate, open interest would likely need to rebuild on the short side or spot selling would need to intensify.
Active Addresses Decline as Market Participation Cools
On-chain activity is also softening. Ethereum active addresses peaked earlier in February before trending lower after February 7. Activity has dropped toward the 520K range, with only a minor uptick recorded on February 16. Declining active addresses suggest reduced speculative participation, lower transaction intensity and cooling engagement following the price breakdown
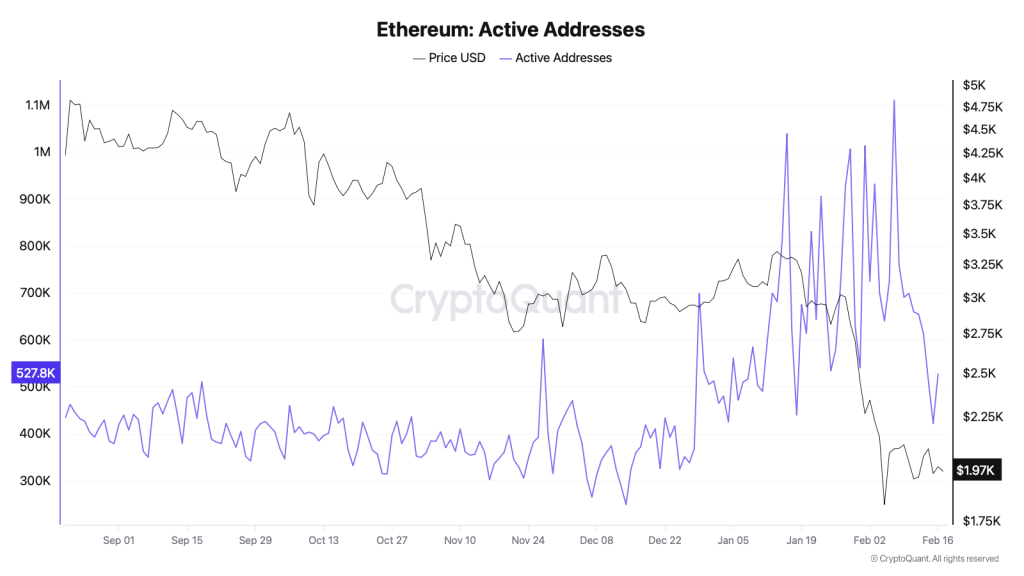
While this does not signal structural network weakness, it aligns with weakening short-term momentum. Participation typically expands during sustained bullish phases. Its contraction during a breakdown reinforces the cautious outlook.
Exchange Reserves Tick Higher After Months of Outflows
For months, Ethereum exchange reserves had been trending lower, a constructive long-term signal suggesting accumulation and reduced immediate sell pressure.
That trend has now begun to shift. Recent data shows a slight increase in exchange balances, implying that ETH may be flowing back to trading platforms.
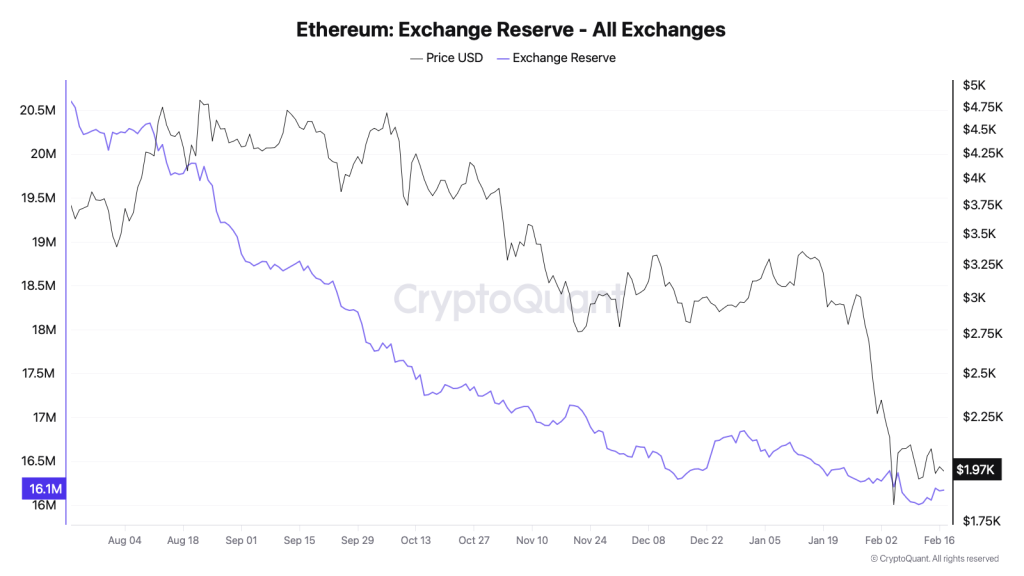
Rising exchange reserves can indicate increased liquidity available for selling, defensive positioning by holders, and preparation for distribution during volatility. Although the broader multi-month trend still leans bullish, the short-term reversal strengthens the bearish case, especially when paired with falling participation and a confirmed technical breakdown.
Ethereum Confirms Weekly Breakdown Below $2,360
From a technical standpoint, Ethereum has invalidated its prior consolidation structure. The $2,300–$2,360 region had acted as a key support zone. The recent breakdown occurred with expanding volume, confirming seller dominance rather than a low-liquidity dip.
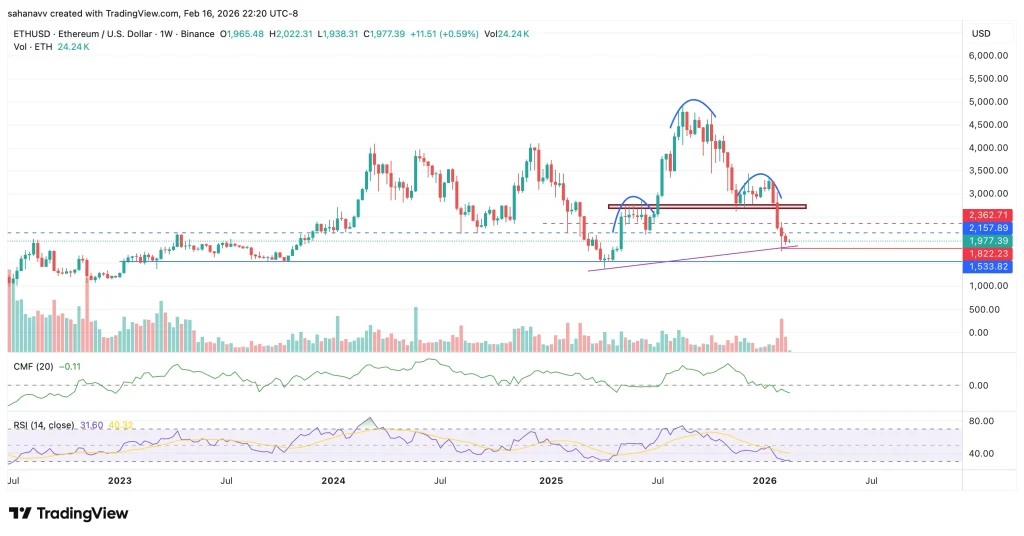
ETH now faces immediate support at:
- $1,820–$1,850 – next weekly demand zone
- $1,530 – major macro structural support
Weekly RSI has dropped toward the low-30 region, approaching oversold territory. However, there is no confirmed bullish divergence, and the price remains below broken support. Until Ethereum reclaims $2,150–$2,200, trend control stays with sellers. On the other hand, the weekly CMF has dropped to -0.12, hinting towards a significant outflow of capital. However, the token continues to defend the rising trendline, which is also the neckline of the head-and-shoulders pattern, keeping the bullish prospects alive.
Will the ETH Price Drop Below $1800?
The bearish narrative may only weaken when the Ethereum (ETH) price reclaims the $2150-$2200 resistance zone. On the other hand, the open interest stabilises, and exchange reserves resume their broader downtrend. Without these signals, the current setup favours continued caution. Besides, with momentum pointing lower and participation cooling, the $1,820 support zone becomes the next decisive test.
The coming sessions will determine whether Ethereum stabilises after the derivatives flush or extends its correction toward deeper macro support.


You May Also Like

Inspired Voyager: Greece’s Top Christian Tour Operator Launches New Site for US Agencies & Churches

Google (GOOGL); Unveils Android CLI 1.0 as AI Agents Get Deeper Dev Access


