

Raydium (RAY) on the Rise: Are Bulls Positioned to Test the $0.75 Resistance?
- Raydium climbs 5%, trading around the $0.67 mark.
- RAY’s trading volume has skyrocketed by over 642%.
While the crypto assets play with the red ball, the broader market sentiment complements the active bearish momentum. Only a few tokens are seen in green. A bullish price action is expected after a steady turn. The largest asset, Bitcoin (BTC), trades at $67.7K, while the largest altcoin, Ethereum (ETH), hovers at $1.9K.
Turning the attention toward the altcoin pack, Raydium (RAY), which landed on the gainer’s page, posted a 5.73% increase in value. In the early hours, it traded at a bottom range of $0.6055, and later rose to a high level of $0.7469. Currently, Raydium traded at $0.6762, with its daily trading volume exploding by over 642%, reaching $130.24 million.
Zooming in on the 4-hour trading chart of Raydium, the upside pressure is seen, and the price could mount toward the $0.6852 resistance. If the bullish trajectory is reinforced, it may push for the emergence of the golden cross and send the price to the $0.69 range or even higher.
Conversely, upon the bullish support fades for Raydium, it might find the initial support at around $0.6675. Assuming this level fails to hold, the bearish correction could strengthen and drive the asset’s price toward $0.65 or lower, with the formation of the death cross.
Technical Setup Points to Upward Momentum for Raydium
The Moving Average Convergence Divergence (MACD) line of Raydium is above the signal line, which indicates bullish momentum. Also, the broader trend is bullish with both lines positioned above the zero line. In addition, the Chaikin Money Flow (CMF) indicator at -0.09 suggests mild selling pressure in the RAY market. As the value is slightly below zero, the capital outflow is present, but not strong, with light distribution.
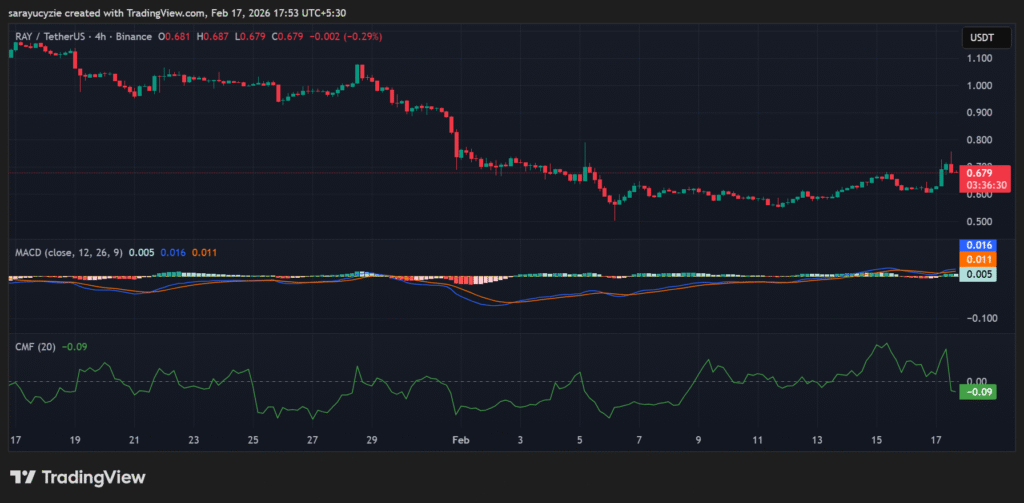 RAY chart (Source: TradingView)
Raydium’s Bull Bear Power (BBP) reading, positioned at 0.052, implies moderate bullish strength. Notably, the buyers are in control, but the ongoing momentum is not very strong. Besides, the daily Relative Strength Index (RSI) is found at 60.86, which hints at restrained bullish sentiment. The value is above the neutral range, thus the asset has enough room for further upside before hitting the overbought zone.
Top Updated Crypto News
Momentum Sparks for PI: Will $0.20 Fall to the Bulls?


You May Also Like

Stakestone (STO) Soars: Token Surpasses $1.14 After Stunning 367% Rally

Is Mt. Gox selling $739 million worth of Bitcoin?

Bitcoin, Gold, and U.S. Stocks Dive as Trump Pledges to Hit Iran ‘Extremely Hard’


