

Bitcoin Just Printed 5 Red Months In a Row – Here’s What BTC Did Last Time This Happened
Bitcoin price has been going down for a long time, dragging the general crypto market with it. The decline began after BTC reached a new all-time high of $126,000 in October 2025.
Since that peak, the asset has dropped close to 50% and now trades near $67,000 at the time of writing. Market structure looks fragile, and confidence feels thin across many major digital assets.
Hope appeared through a recent post from the analyst known as Finish. The message highlighted a rare historical pattern that few traders ignore. Finish explained that BTC has now printed five red monthly candles in a row. History shows this event happened only once before.
The previous occurrence came before a powerful threefold rally that changed market sentiment very quickly. Finish argued that news tends to follow price direction. Fear usually disappears once price strength returns. The comment frames the current decline as a possible late-stage correction instead of a permanent breakdown.
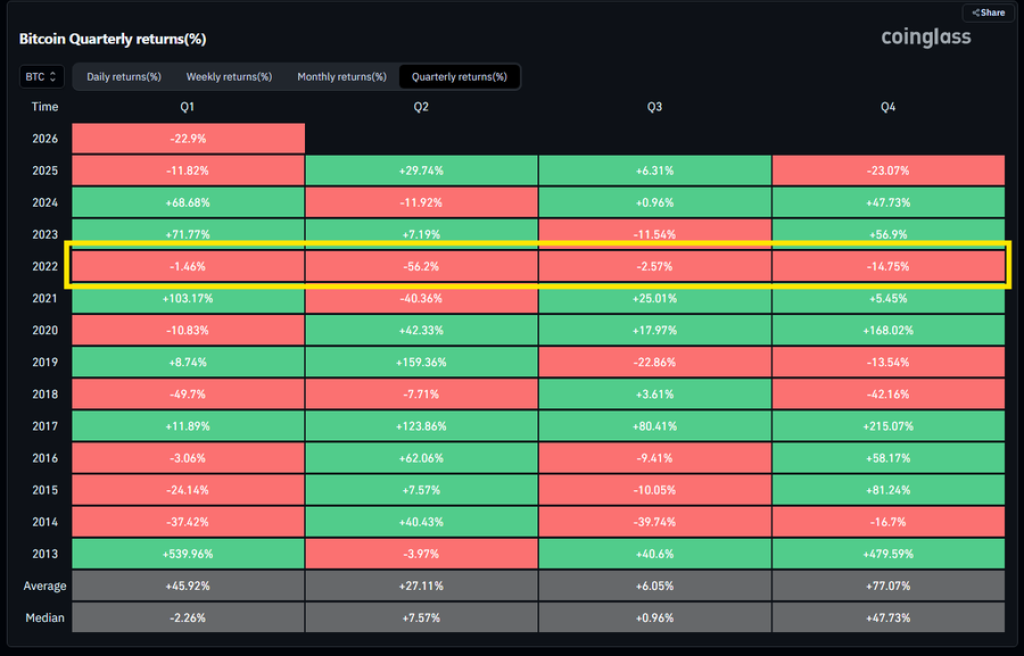
Another analyst named charlez presented a more cautious interpretation of Bitcoin history. Charlez shared a chart that focused on quarterly performance during the 2022 bear market. The data shows Bitcoin recorded four consecutive red quarters during that period.
Losses stacked across the entire year and created one of the harshest drawdowns in BTC history. Charlez expressed concern that a similar structure could appear again if downside pressure continues.
Bitcoin Quarterly Losses In 2022 Show How Deep Bear Markets Can Extend
The 2022 sequence reveals how persistent selling pressure can become once momentum turns negative. First quarter performance showed a decline of about 1.46%.
Second-quarter losses accelerated sharply to roughly 56.2%. Third quarter remained negative with a drop near 2.57%. The fourth quarter closed the year with another fall close to 14.75%.
Four straight losing quarters formed a full year of contraction that tested long term conviction across the crypto sector.
This historical stretch matters because current price behavior shares emotional similarities with that earlier cycle. Extended weakness often creates disbelief before recovery begins.
Bitcoin eventually stabilized after the 2022 downturn and later entered a powerful bull phase that pushed price toward the $126,000 peak seen in 2025. That recovery proves severe drawdowns do not automatically end the broader BTC growth story.
Five Consecutive Red Bitcoin Months Highlight A Rare Moment For BTC Price
Finish continues to emphasize the rarity of the current monthly streak. Five red months in sequence represent extreme bearish persistence. Previous market cycles show that unusual downside clusters sometimes appear near turning points.
The earlier example referenced by Finish preceded a strong upward expansion that multiplied Bitcoin value within months. Historical repetition never guarantees the same outcome. Patterns still provide context for evaluating risk and opportunity.
Charlez maintains a defensive tone despite that historical precedent. Quarterly data from 2022 demonstrates that declines can last longer than expected.
Another stretch of multi-quarter weakness would likely pressure sentiment across the entire digital asset market. Traders therefore, watch both monthly and quarterly structures to judge whether BTC approaches exhaustion or continuation.
 @charlezmg_ / X
Current BTC positioning sits between two powerful historical lessons. Finish highlights the explosive rebound that followed a similar monthly pattern in the past.
Charlez points to the prolonged quarterly collapse that defined the 2022 bear market. Both perspectives rely on real Bitcoin data and each offers a different path forward for BTC price.
Read Also: Hedera (HBAR), Ethereum (ETH), and ONDO: Which Altcoin Will Dominate the RWA Sector?
Bitcoin has survived deep crashes before and later produced new highs that reshaped the entire crypto landscape. Present conditions feel uncertain, yet uncertainty has always been part of Bitcoin’s story. Market history shows that extreme fear and major opportunity often appear in the same moment.
Subscribe to our YouTube channel for daily crypto updates, market insights, and expert analysis.
The post Bitcoin Just Printed 5 Red Months In a Row – Here’s What BTC Did Last Time This Happened appeared first on CaptainAltcoin.


You May Also Like

Binance Commits $500K to Ukraine Digital Resilience Lab for Web3 Development

Western Union Launches USDPT Stablecoin on SOL


