

Here’s Why MYX Finance (MYX) Price Pumped 75% After the Heavy February Selloff
MYX Finance (MYX) had a brutal 66% weekly drop between February 7 and February 14, with price sliding toward $1.29 and ranking among the hardest-hit altcoins in that stretch. Afterwards, the MYX price continued to dip, toward the $1.00 level. CoinMarketCap data now shows MYX is now trading around $1.70, up roughly 75% in the last 24 hours. However, the token remains down about 46% over the past 7 days and nearly 69% over the past 30 days, leaving it approximately 91% below its all-time high.
The logical question we can now ask: is this the beginning of a real recovery, or just a reflex bounce after extreme selling pressure?
Consensys-Led Funding Round Sparks Confidence
Two days ago, MYX announced that Consensys led its latest strategic funding round, with participation from Mesh, Systemic Ventures, and Ethereal Ventures. More importantly, Consensys has officially become the largest investor in MYX Finance.
That kind of backing carries weight. Consensys is deeply embedded in Ethereum infrastructure, and having it as a core partner signals long-term alignment rather than short-term speculation. The announcement also reinforced MYX’s positioning as the leading derivatives DEX on BNB Chain and the largest derivatives platform on Linea, with cumulative trading volume surpassing $95 billion.
In heavily oversold conditions, strong fundamental catalysts often act as ignition points. After weeks of persistent distribution, the funding news likely triggered short covering and aggressive dip buying, which accelerated the 75% rebound.
MYX Chart Analysis: Technical Bounce or Structural Reversal?
We had a look at the MYX chart and the February structure is clearly bearish. MYX topped near the $6.50–$7.00 region earlier this month before entering a sustained downtrend. The breakdown below the $4.50 zone marked a major structural shift, followed by cascading sell pressure that drove price to a low near $1.00–$1.20.
The recent pump appears to have originated from a clear exhaustion zone just above $1.00. The MYX price formed a local base before exploding vertically toward the $1.70 area. That kind of move indicates short covering combined with fresh speculative inflows rather than gradual accumulation.
Immediate resistance now is now at around $1.75–$1.80, which aligns with a prior breakdown level. Above that, the next key resistance zone lies near $2.00–$2.20, where multiple lower highs formed during the dip. If bulls manage to reclaim $2.20 this week, momentum could extend toward the $2.80–$3.00 region. That being said, for this kind of move, market would need to help as well (and it’s not heling right now).
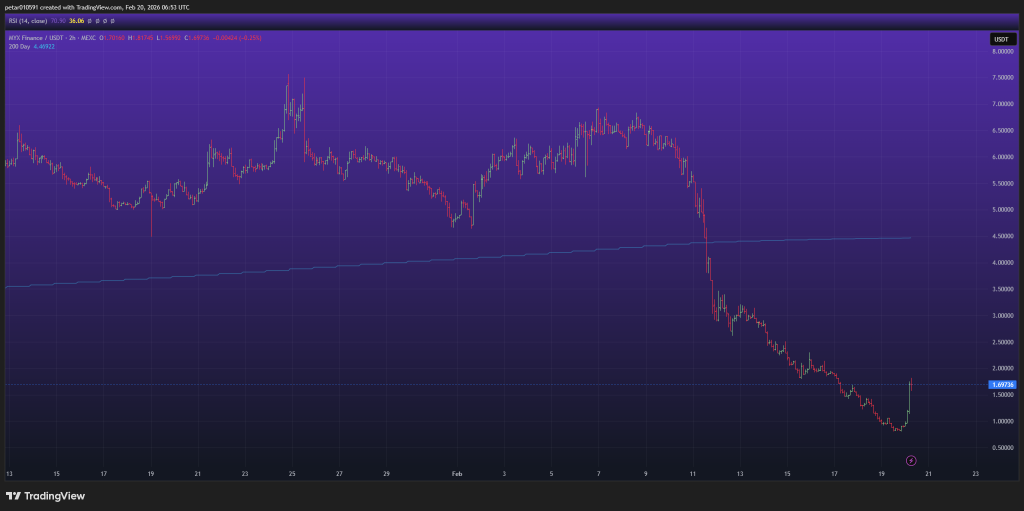 Source: TradingView
On the downside, short-term support now forms around $1.45–$1.50. Losing that area would likely open a retest of the $1.20 region. A breakdown below $1.20 would invalidate the recovery structure and re-expose the psychological $1.00 level.
RSI and Momentum Outlook
The RSI on the 2-hour timeframe currently sits in the mid-30s to low-40s range, recovering from deeply oversold territory. During the selloff, RSI stayed suppressed for days, confirming strong bearish control. The recent spike pushed momentum upward quickly, but it has not yet entered extreme overbought territory.
That suggests two possible scenarios over the next few days:
- Bullish continuation: If MYX consolidates above $1.50 and RSI holds above 40–45, a secondary push toward $2.00 becomes likely.
- Relief rally fade: If RSI rolls over and price fails to hold above $1.50, this move could unwind quickly as late buyers get trapped.
Given the magnitude of the previous drawdown, volatility is expected to remain elevated. Sharp 10–20% intraday swings are not unlikely in the near term.
Read also: Iran-US Conflict Could Trigger a Bitcoin Crash – Watch Crude Oil, Not Crypto Twitter
MYX Price Forecast for the Coming Days
In the short term (next 3–5 days), the key level to watch is $1.75. A decisive break above that zone could accelerate momentum toward $2.00–$2.20.
If the MYX price instead stalls below resistance and drops under $1.50, expect a pullback toward $1.20 as traders lock in quick profits from the 75% surge.
For now, this looks like a technically justified relief rally fueled by strategic funding news and extreme oversold conditions. Whether it evolves into a sustained trend reversal depends entirely on whether buyers can defend the $1.45–$1.50 region and push through overhead resistance with conviction.
The funding catalyst gave MYX a spark. The next few sessions will determine whether it becomes a sustained recovery or just another bounce in a larger downtrend.
Subscribe to our YouTube channel for daily crypto updates, market insights, and expert analysis.
The post Here’s Why MYX Finance (MYX) Price Pumped 75% After the Heavy February Selloff appeared first on CaptainAltcoin.


You May Also Like

Metaplanet buys 5,075 Bitcoin in Q1 to become 3rd-largest treasury

Najin, One of the Last White Rhinos, Killed in Poaching Attack


