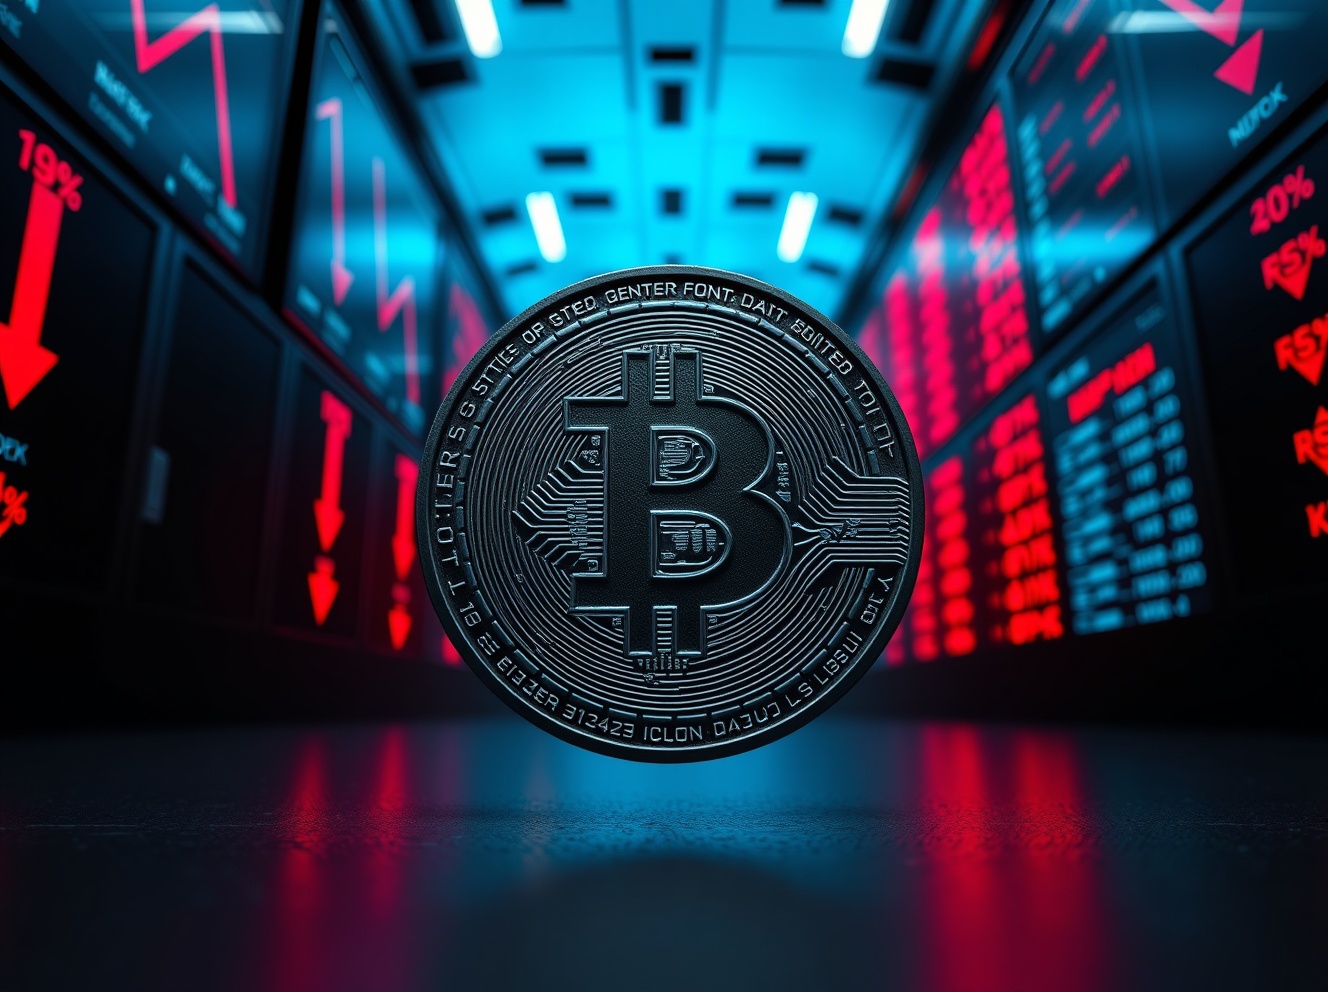
Injective (INJ) Rallies 17.9% Despite 92% Drawdown From All-Time High
Injective Protocol’s native token INJ posted a sharp 17.9% gain in the past 24 hours, reaching $3.87 as of February 21, 2026. This surge represents the strongest single-day performance for the DeFi-focused Layer-1 blockchain in several weeks, accompanied by a dramatic 155% increase in trading volume to $155.4 million. Our analysis examines whether this rally signals a sustainable trend reversal or represents another relief bounce in a prolonged downtrend.
The price action becomes particularly interesting when contextualized against INJ’s historical performance. Trading at $3.87, the token remains 92.6% below its all-time high of $52.62 reached in March 2024—a drawdown that exceeds many blue-chip altcoins during the current market cycle. Yet the 7-day chart shows a 22% gain, suggesting accumulation may be occurring at these depressed levels.
Volume Spike Signals Institutional Interest Returning
The most compelling data point from this rally isn’t the price movement itself, but rather the volume profile. At $155.4 million in 24-hour trading volume against a market capitalization of $385 million, we’re observing a volume-to-market-cap ratio of approximately 40%—significantly above the 10-15% range typical for established altcoins. This elevated ratio typically indicates either aggressive speculation or, more optimistically, renewed institutional positioning.
What makes this particularly noteworthy is the timing. The surge occurred during a period when broader DeFi metrics have shown mixed signals, with total value locked across protocols remaining relatively flat. Injective’s performance stands out against competitors in the Layer-1 DeFi space, many of which posted modest 3-7% gains during the same period.
We observe that INJ’s price action formed a local bottom at $3.25 before surging to an intraday high of $3.96—a 21.8% swing range that suggests aggressive buying pressure overcame resistance levels. The fact that the token settled at $3.87, maintaining 92% of the intraday gains, indicates this wasn’t merely a liquidity-driven spike but potentially reflects sustained demand.
On-Chain Metrics Point to Network Growth Despite Price Struggles
While price action grabs headlines, the underlying fundamentals of Injective Protocol reveal a more nuanced picture. The protocol’s fully diluted valuation matches its market cap at $385 million, indicating that all 100 million INJ tokens are currently in circulation—a factor that eliminates future dilution concerns that plague many competing protocols.
This complete token distribution represents a double-edged sword. On one hand, it removes the selling pressure from token unlocks that have suppressed prices across much of the DeFi sector in 2025-2026. On the other, it means price appreciation must derive purely from increased demand and network usage rather than supply constraints.
The 30-day performance data shows INJ down 16.9%, creating an interesting divergence with the strong 7-day (+22%) and 24-hour (+17.9%) performance. This pattern suggests a potential trend inflection point, though we remain cautious about declaring a definitive reversal without sustained follow-through above the $4.00 psychological level.
Technical Levels and Resistance Zones to Watch
From a technical perspective, INJ faces significant overhead resistance. The $3.96 intraday high represents the immediate test, but more substantial resistance clusters exist at $4.50 (psychological level), $5.80 (previous local high from Q4 2025), and $7.20 (50% Fibonacci retracement from the all-time high). Each of these levels likely holds accumulated sell orders from investors looking to exit positions established at higher prices.
The support structure appears more robust than many observers might expect given the 92% drawdown. Our analysis identifies key support zones at $3.25 (recent low), $2.90 (200-day moving average, approximate), and $2.45 (psychological level). A breakdown below $3.25 would invalidate the bullish thesis and suggest the rally was merely a relief bounce within an ongoing downtrend.
What concerns us more than technical levels is the relative strength comparison. Against Bitcoin, INJ has underperformed dramatically since March 2024, losing roughly 85% of its BTC-paired value. For a sustainable bull case to develop, INJ needs to demonstrate it can outperform BTC on a consistent basis—something it hasn’t achieved since early 2024.
Comparative Analysis: How Injective Stacks Up Against Layer-1 Competitors
To properly assess INJ’s 17.9% surge, we must contextualize it within the broader Layer-1 DeFi ecosystem. Injective positions itself as a purpose-built blockchain for DeFi applications, particularly decentralized derivatives and advanced trading protocols. This specialization differentiates it from general-purpose Layer-1s like Ethereum or Solana.
At a market cap rank of #114, Injective occupies a middle tier in the cryptocurrency hierarchy—large enough to attract institutional attention but small enough to generate significant percentage moves on moderate volume. The $385 million market cap seems undervalued when compared to protocols with similar technical capabilities but less specialized use cases, though this valuation discount may reflect concerns about Injective’s ability to capture market share in an increasingly competitive DeFi landscape.
The protocol’s all-time high of $52.62 in March 2024 coincided with a broader DeFi renaissance that lifted most boats. At those levels, INJ commanded a market cap exceeding $5 billion. The current 92.6% retracement suggests either that peak was dramatically overvalued, or that significant upside potential exists if Injective can recapture even a fraction of that previous market confidence.
Risk Factors and Contrarian Perspectives
Despite the impressive 24-hour performance, several risk factors temper our enthusiasm. First, the 30-day chart showing a 16.9% decline indicates this rally occurs within a broader downtrend. Without sustained volume and follow-through above $4.00, this move could represent nothing more than a short squeeze or relief bounce.
Second, the cryptocurrency market in early 2026 remains structurally challenging for mid-cap altcoins. Bitcoin dominance has gradually increased, suggesting capital flows favor established assets over speculative alternatives. Injective needs to demonstrate it can attract and retain users, not just traders, to justify higher valuations.
Third, the DeFi sector faces headwinds from increasing regulatory scrutiny, particularly around derivatives protocols—Injective’s core competency. While the protocol’s decentralized architecture provides some regulatory buffer, heightened compliance requirements could impact growth trajectories across the sector.
A contrarian perspective worth considering: perhaps the market has overcorrected on INJ. A 92% drawdown from all-time highs exceeds most fundamental deterioration in the protocol itself. If Injective can demonstrate consistent network growth and increasing transaction volumes, current prices may represent significant value for risk-tolerant investors with 12-24 month time horizons.
Trading Implications and Price Outlook
For traders considering positions, the risk-reward setup presents both opportunities and challenges. The immediate resistance at $3.96 suggests short-term traders might look to take profits, while a clean break above $4.00 with sustained volume could target $4.50-$5.00 in coming weeks.
Our base case scenario anticipates consolidation between $3.50-$4.20 over the next 7-14 days as the market digests this move. A bullish scenario, contingent on continued volume and broader market support, could see INJ test $5.80 by March 2026. The bearish scenario involves rejection at current levels and a retest of $3.25 support, with a breakdown potentially targeting $2.90.
What we’ll be monitoring closely: daily trading volume sustainability above $100 million, Bitcoin correlation coefficients (lower correlation suggests independent strength), and network activity metrics including daily active addresses and transaction counts. Price alone tells an incomplete story—sustainable rallies require fundamental backing.
Key Takeaways and Risk Considerations
The 17.9% surge in INJ represents significant short-term price action but must be evaluated within the context of a 92% drawdown from all-time highs and ongoing DeFi sector challenges. The volume spike to $155 million is encouraging and suggests renewed interest, but follow-through above $4.00 is essential for confirming a trend reversal.
For investors, current levels present asymmetric risk-reward if you believe in Injective’s long-term value proposition, but position sizing should reflect the high volatility and downside risk inherent in mid-cap altcoins. We recommend waiting for confirmation above $4.50 before establishing full positions, or dollar-cost-averaging into positions with strict stop-losses below $3.00.
The next 48-72 hours will prove critical. If INJ can hold above $3.75 and maintain elevated volume, the probability of testing $4.50-$5.00 increases substantially. Conversely, failure to hold $3.60 would suggest the rally lacks conviction and could prompt a retest of recent lows. As always, risk management supersedes opportunity—never invest more than you can afford to lose in volatile assets like INJ.


You May Also Like
Trump’s July 4 plans a 'chaotic' mess as internal emails reveal war between 2 factions

One of Trump’s Supreme Court appointees just saved the late mail ballots he hates so much