

Polymarket Prediction Bets Defy Bitcoin's Price Crash

With the price of Bitcoin down to roughly around $63,200, it's clear that market uncertainty is still present. There has been no strong rising momentum, as the general trend since the weekend shows a significant decline.
Nonetheless, one prediction market's posture suggests a far brighter outlook.
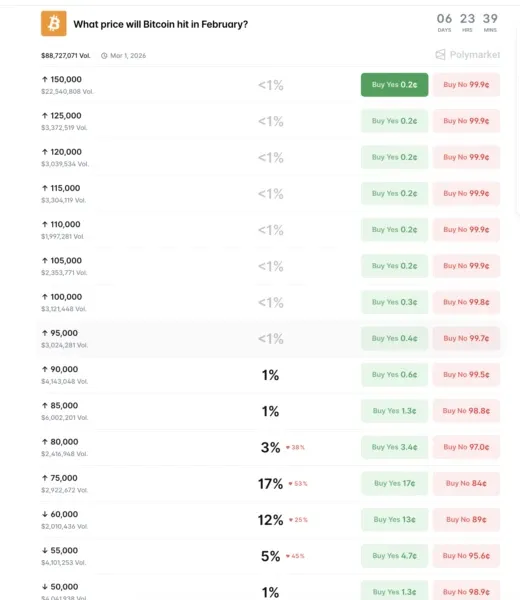
With a 17% probability, the most important event for February on Polymarket is that Bitcoin will go beyond $75,000.
This makes it the clear frontrunner for directional bias as we approach the end of the month. However, this positive vision can be shattered by the present market dynamics, blockchain interactions, and the posture of major investors.
Despite a general downturn in mood, market projections show that the goal of "above $75,000" remains the most chosen alternative for February.
This wager on Polymarket has topped $88 million in volumes, indicating a substantial amount of active liquidity.
The confidence level has dropped, though, and the chances of getting the $75,000 result have dropped by more than half. Also, the second most likely possibility is "below $60,000," which has a 12% chance of happening.
This position emphasizes the growing difference in expectations.
 Source: Polymarket
A large portion of the market is preparing for a more severe drop rather than the gains that many traders are still hoping for.
There is a strong correlation between the Bitcoin network's technical readings and this growing caution. Bitcoin reached a new low on the daily chart between November 15 and February 16. This means that the price's most recent attempt at a rally was not successful in bringing about a full recovery.
The RSI, a measure of momentum strength, hit a new high at the same time. This points to a hidden negative divergence, as Bitcoin was already trending lower.
In most cases, this pattern does not signal a positive comeback but rather suggests that the present slump will likely endure. It shows that although momentum did briefly increase, the overall trend of selling pressure is still going strong.
The price of Bitcoin has decreased by nearly 6% since the initial appearance of this divergence.
While this signal remains in play, the prospects of achieving the $75,000 target established by the prediction market appear quite dim.
What the Whales Are Doing?
The behavior of long-term investors reveals the persistent confidence in prediction markets, even while risks are on the rise.
It is possible that the whales kept their Bitcoin holdings for more than a year. The length of time that Bitcoin stays in an upward or downward trend is often dictated by their trading habits.
According to TradingView, the 30-day rolling change shows that long-term holders sold off 244,919 BTC on February 5, suggesting a lot of selling pressure.
The value increased to 81,019 BTC on February 21. There has been a noticeable 67% reduction in selling pressure, as shown above.
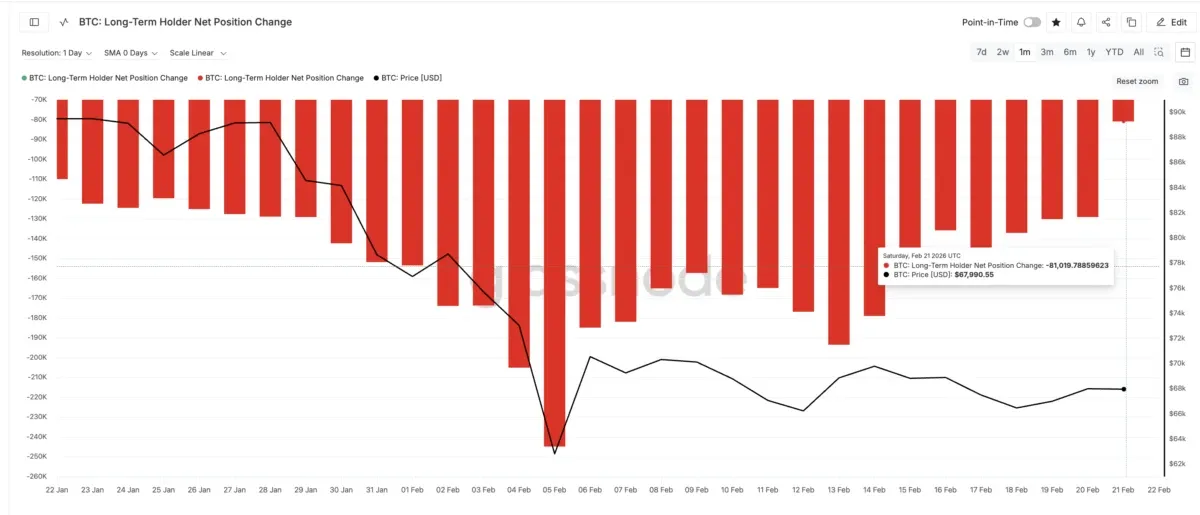
This notable reduction in selling activity contributes to the stabilization of Bitcoin’s price and clarifies why certain traders maintain a positive outlook for future gains.
Nonetheless, those who maintain their positions over the long haul are still predominantly selling off their assets. They have not yet moved into the phase of building their assets. Their engagement has shown progress, yet they have not yet delivered the robust purchasing backing required to propel Bitcoin to new peaks.
This establishes a balanced approach.
Bitcoin might steer clear of a sudden downturn, yet it appears to be missing the momentum required for a significant surge towards the $75,000 mark.
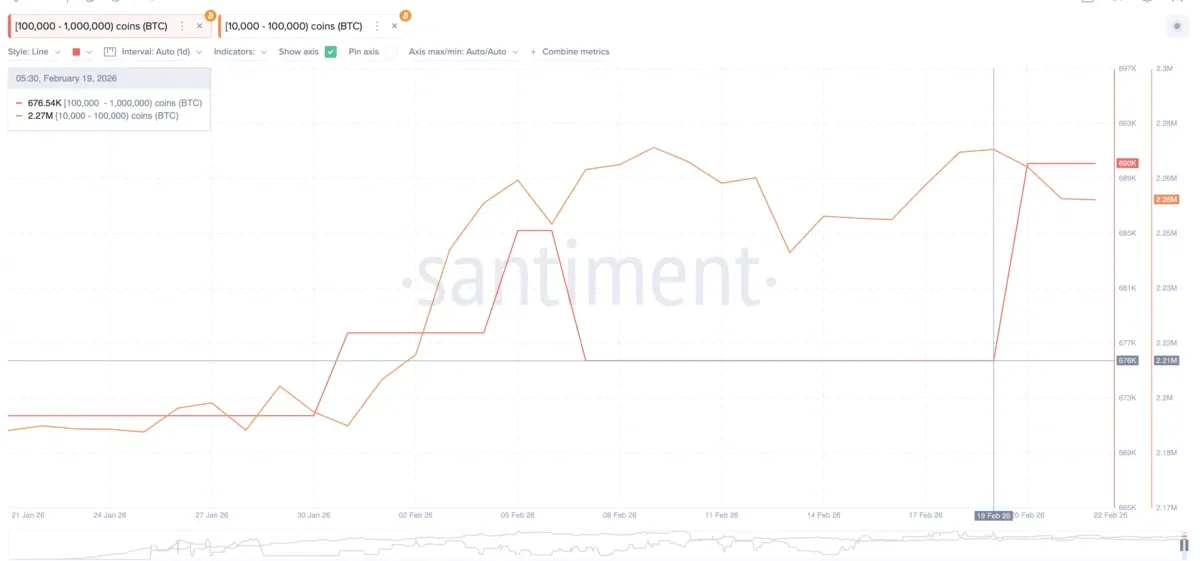
The placement of major actors also suggests a lack of clarity. The leading Bitcoin holders, possessing between 100,000 and 1 million BTC, have raised their total holdings to 690,000 BTC, up from 676,540 BTC. This reflects a prudent strategy in acquiring assets, resulting in an accumulation of approximately 13,460 BTC.
There has been a reduction in the assets of smaller ehales with 10,000 to 100,000 BTC from 2.27 million BTC to 2.26 million BTC. During that period, almost 10,000 BTC were sold.
This contrasting behavior indicates a deficiency in cohesive belief, despite the overall tendency leaning slightly towards accumulation.
Some major players are positioning themselves for a recovery, while others are taking a cautious approach.
From $72,600 to $73,200, there is a considerable resistance area, according to the cost base distribution data.
The accumulation of over 149,000 BTC was made possible by this range. These levels, which are slightly below $75,000, clearly indicate a substantial obstacle on the price chart.
A lot of Bitcoin holders would think about selling when this level is approaching, just to break even.
As things stand, the whale population isn't growing fast enough to consume the available resources. This downward pressure on prices creates a substantial barrier that prediction systems may be ignoring. For Bitcoin to achieve the anticipated target of $75,000, it needs to surpass the level of $72,200 first.
This level signifies a crucial point of technical resistance and is situated near one of the most significant cost basis clusters. To surpass this threshold, a surge exceeding 6% from the present levels is necessary.
Nonetheless, not overcoming this barrier heightens the chances of persistent sideways activity.
On the downside, there is significant backing between $64,300 and $63,800, where around 150,000 BTC have been gathered.
Near $63,300, according to the Bitcoin price chart, is a critical support level.
If the price drops below this level, the supply cluster is likely broken. Falling prices beneath $63,300 could lead to a drop into the $60,000 range, aligning with Polymarket's forecast of a 12% likelihood.
Consequently, Bitcoin finds itself positioned between two significant price levels. Resistance around $72,200 constrains potential gains, whereas support at approximately $63,300 safeguards against a swift downturn.
The current sentiment in the prediction markets appears overly optimistic regarding a potential climb to $75,000, given the prevailing range-bound structure.
There seems to be a disregard for the increasing risks associated with further consolidation or a potential reversal.
Blockcast – Licensed to Shill: How Energy & Geopolitics Are Building a Bitcoin-Driven World, ft. Bitcoin Arabia's Lara Eggimann & Jeff Gorman
The Middle East is poised to become a pivotal hub in the global cryptocurrency ecosystem. Countries within the region are increasingly recognizing the strategic importance of integrating blockchain technology into their economic frameworks, energy markets, and geopolitical strategies, according to Lara Eggimann and Jeff Gorman, co-founders of Bitcoin Arabia, a strategic Bitcoin advisory and ecosystem builder that connects the global Bitcoin industry with the Middle East’s most powerful stakeholders.
Thanks for tuning in! If you enjoyed this episode, please like and subscribe to Blockcast on your favorite podcast platforms like Spotify and Apple.
Be at the heart of TradFi–DeFi collaboration at Money20/20 Asia 2026.

Are you looking to forge partnerships with banks and fintechs? To expand into new markets across Asia, or to secure funding from top-tier investors? This April, the world of digital assets, blockchain, and Web3 converges with the biggest players in APAC’s financial ecosystem at Money20/20 Asia 2026 and its brand new ‘Intersection’ zone, complete with a dedicated content stage, TradFi-Defi innovator showcase, and curated networking spaces. From traditional banking giants to decentralised innovators, private equity leaders, and cutting-edge fintech disruptors, this is where they meet to forge partnerships, spark dialogue, and shape the future of finance.


You May Also Like

Siren (SIREN) Plunges 26.7% in 24 Hours: On-Chain Data Reveals Troubling Pattern

AI giants Meta, Microsoft, NVIDIA stocks slip amid Iran threat, AI cryptos crash


