

Ripple prezzo: XRPUSDT below key moving averages as intraday traders attempt a bounce

Market participants are watching Ripple prezzo closely as XRPUSDT tries to stabilize intraday against a clearly weak higher timeframe backdrop.
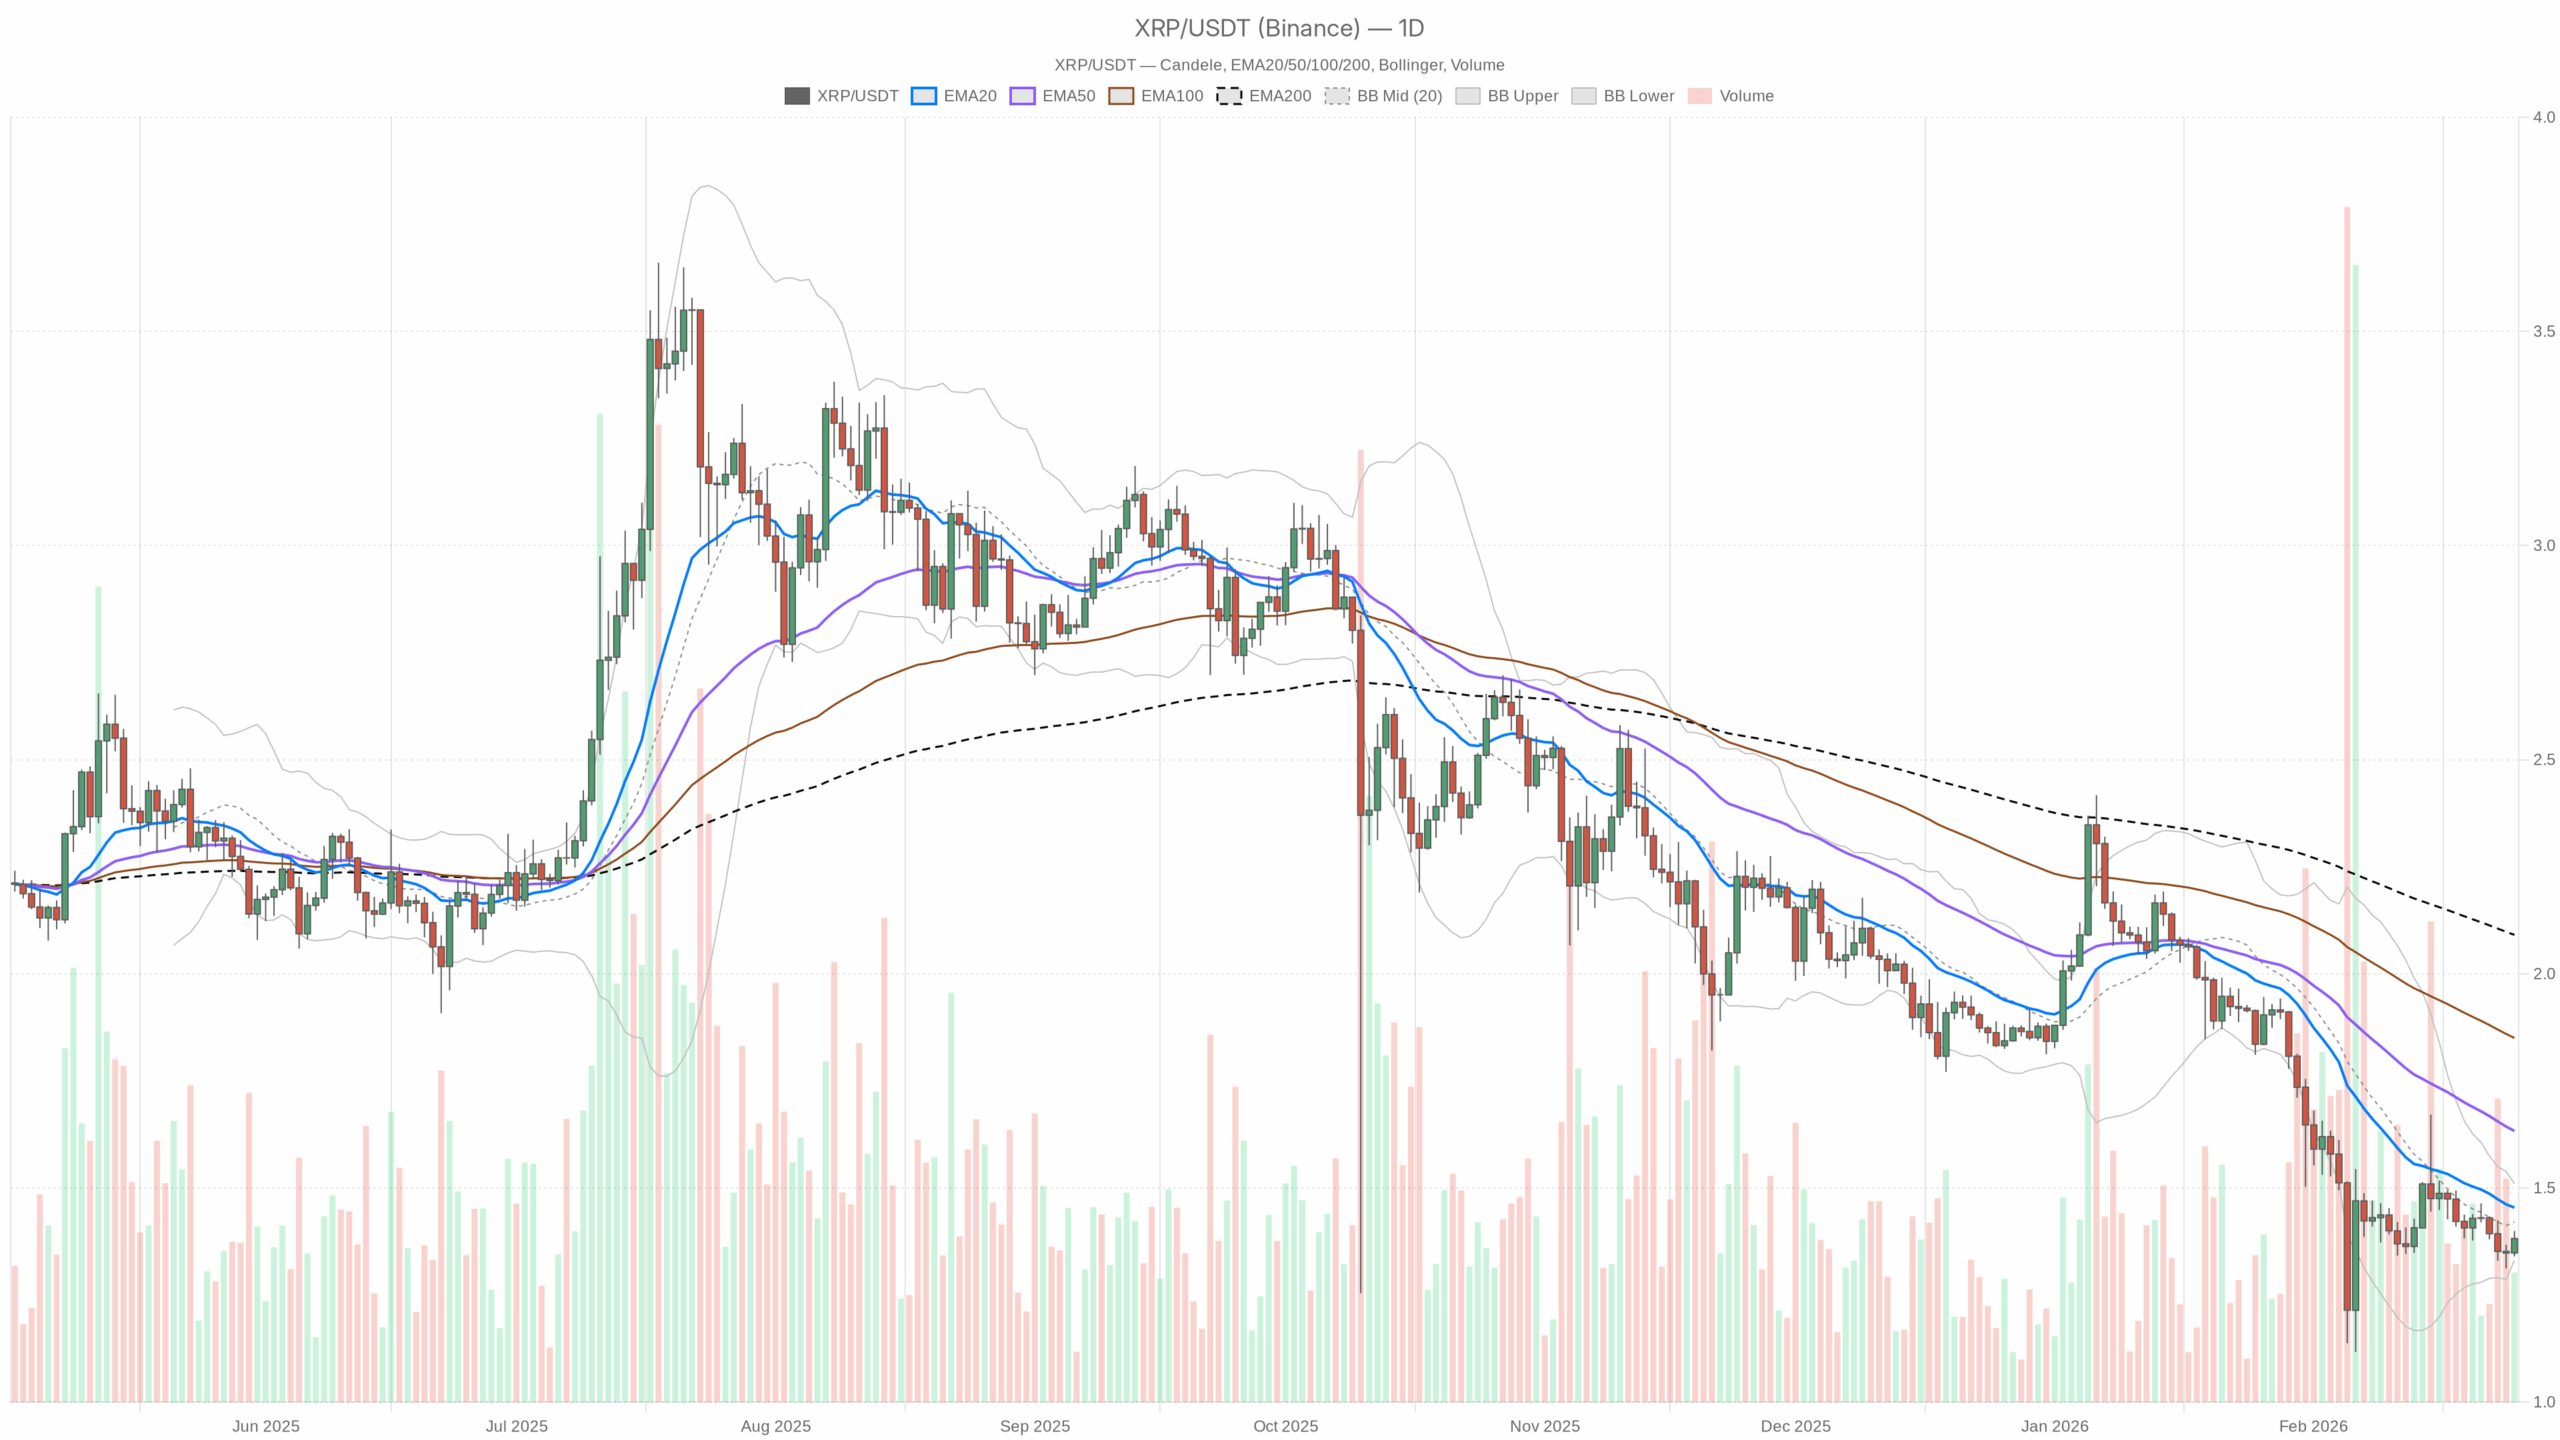 XRP/USDT daily chart with EMA20, EMA50 and volume”
loading=”lazy” />XRP/USDT — daily chart with candlesticks, EMA20/EMA50 and volume.
Daily timeframe: structure still bearish
XRPUSDT is trying to stabilize around 1.38, but it is doing so below every major daily moving average. That combination – short-term intraday strength against a weak higher timeframe structure – defines the current moment. Bulls are active on the lower timeframes, yet they are trading against a broader downtrend and an extremely fearful macro backdrop.
Why this matters now: the overall crypto market cap is up about 3.2% in the last 24 hours with BTC dominance at 56%, but the Fear & Greed index sits in Extreme Fear (11). That means positioning is thin and reactive. Any move in XRP from here is likely to be sharp: either a short-covering squeeze if the bounce expands, or an air-pocket lower if support breaks and liquidity disappears.
The main scenario on the daily chart is bearish. Price closed at 1.38, with the regime tag correctly reading “bearish” given where the pair is relative to trend.
Trend context: EMA20 / EMA50 / EMA200
- EMA20 (daily): 1.45
- EMA50 (daily): 1.63
- EMA200 (daily): 2.09
XRP is trading below all three EMAs, and they are stacked bearishly (price < 20 < 50 < 200). The short end of the curve (20-day) has rolled over and is now solidly under the 50-day, confirming that this is not just a brief dip. Instead, it is a sustained downtrend. Any rally while price sits under 1.45–1.63 is, by definition, a rally into resistance, not the start of a confirmed new uptrend.
Momentum: RSI and MACD on D1
- RSI 14 (daily): 38.97
Daily RSI is below 40, which is classic bearish momentum territory but not oversold. Sellers are in control, but the move is not exhausted yet. This leaves room for further downside without needing a major relief rally first. However, it also means any bounce from here is more likely a pause within a downtrend than a clean trend reversal.
- MACD (daily): line -0.08, signal -0.09, histogram 0.01
MACD is negative but the histogram has flipped slightly positive, showing bearish momentum is easing after a leg down. That often aligns with consolidation or a corrective bounce. It does not turn the chart bullish on its own; it simply says the aggressive part of the selloff has cooled for now.
Volatility and ranges: Bollinger Bands, ATR, pivots (D1)
- Bollinger Bands (daily): mid 1.42, upper 1.51, lower 1.33
Price is sitting slightly below the mid-band (1.42) and closer to the lower band (1.33). That is consistent with a market pressing the lower half of its recent range rather than trending strongly in either direction right this second. The lower band at 1.33 is a natural line in the sand for this consolidation. A clean daily close below it would signal a fresh expansion lower.
- ATR14 (daily): 0.08
Daily ATR around 0.08 says the recent average daily range is roughly 6% of price. That is moderate for XRP: not a volatility spike, but enough movement that trying to pick exact tops or bottoms is dangerous. Intraday swings of 0.05–0.10 are perfectly normal in this regime.
- Daily pivot (classic): PP 1.37, R1 1.41, S1 1.35
The daily close at 1.38 is sitting right on top of the daily pivot point at 1.37. That makes 1.37–1.38 a battle zone. Above this band, price can probe toward 1.41 (R1), which coincides with the Bollinger mid-region around 1.42. Below it, the first downside magnet is 1.35 (S1), not far from the lower band at 1.33.
Intraday (H1): bounce fighting the higher timeframe downtrend
The hourly chart is trying to build a countertrend bounce inside that larger bearish structure.
Trend on H1: EMAs and regime
- H1 close: 1.38
- EMA20 (H1): 1.37
- EMA50 (H1): 1.36
- EMA200 (H1): 1.40
- Regime (H1): neutral
On the hourly, price is trading above the 20 and 50 EMA, but still below the 200 EMA. That is typical of an early or fragile bounce: short-term traders have stepped in, but they have not yet broken the key medium-term level at 1.40. The neutral regime tag sums it up well: it is a recovery, not a trend yet.
H1 momentum: RSI and MACD
- RSI 14 (H1): 61.45
Hourly RSI in the low 60s shows intraday bullish momentum. The market is pressing higher within the day, which lines up with the short-term EMA structure. However, with the daily RSI still below 40, this is more likely short covering and opportunistic buying inside a broader downtrend than the start of a multi-day leg higher.
- MACD (H1): line 0.01, signal 0, histogram 0
MACD on H1 is marginally positive and flat. Momentum is slightly in favor of buyers but without strong follow-through. It is the kind of read you would expect in a slow grind higher or a pause before the next directional move.
H1 Bollinger Bands, ATR, pivot
- Bollinger Bands (H1): mid 1.36, upper 1.39, lower 1.34
Price is hovering in the upper half of the hourly Bollinger envelope, close to 1.39. That shows buyers keeping pressure on the upside intraday, but with the upper band just above, there is not a lot of room before short-term stretched conditions appear unless volatility expands.
- ATR14 (H1): 0.02
An hourly ATR of 0.02 points to relatively tight intraday ranges at the moment. Breakouts through 1.39–1.40 or below 1.36 will likely stand out because they will exceed the usual bar-to-bar noise.
- H1 pivot: PP 1.38, R1 1.39, S1 1.38
The hourly pivot is also at 1.38, with a very tight band between support and resistance. This reinforces the idea that 1.38–1.39 is a key intraday inflection area. Sustaining trade above 1.39 would open the door toward the 1.40–1.41 region, while dropping back under 1.38 would hand control back to sellers.
Execution layer (M15): short-term bulls in control, but right under resistance
The 15-minute chart is bullish, but it is operating directly into nearby resistance zones defined by the H1 and D1 levels.
- M15 close: 1.38
- EMA20 (M15): 1.37
- EMA50 (M15): 1.37
- EMA200 (M15): 1.36
- RSI 14 (M15): 62.6
- MACD (M15): line 0, signal 0, histogram 0
- Bollinger Bands (M15): mid 1.37, upper 1.39, lower 1.36
- ATR14 (M15): 0.01
Short-term EMAs are all below price and positively aligned, with RSI north of 60. That is a clean intraday up-bias: the path of least resistance on very short timeframes is still higher. But with the upper 15-minute band around 1.39 and the hourly 200 EMA at 1.40, the 1.39–1.40 pocket is a clear decision area where this micro-trend either accelerates into a bigger squeeze or stalls into a pullback.
Reconciling the timeframes
There is explicit tension between timeframes:
- Daily: bearish trend, momentum still on the weak side (RSI < 40), price under all major EMAs.
- Hourly: neutral regime with a mild bullish tilt (price above 20/50 EMA, below 200 EMA, RSI > 60).
- 15m: short-term bullish regime into nearby resistance.
Put simply, intraday traders are leaning bullish, but they are swimming against a larger down-current. That is a textbook setup for either a controlled short-covering rally into resistance or a failed bounce that re-aligns all timeframes to the downside.
Clear bullish scenario for XRPUSDT
Given the daily backdrop, any bullish view here is tactical and conditional, not structural. In that context, the behavior of Ripple prezzo on the next few sessions is crucial for short-term traders.
Bullish path: Bulls want to see the current intraday strength transition into a higher timeframe repair. Practically, that means:
- Holding above the 1.37–1.38 pivot zone on closing bases (H1 and ideally D1).
- Breaking and holding above the hourly 200 EMA and overhead band at 1.39–1.40.
- Using that as a base to attack the 1.41–1.42 area, where the daily pivot R1 and Bollinger mid-band sit.
If price can establish a series of higher highs and higher lows above 1.40 on the hourly chart, you would likely see daily RSI lift back toward 45–50 and MACD move closer to a zero-line cross. That would shift the conversation from dead cat bounce to early base-building. The next obvious upside reference after 1.42 would be the daily EMA20 around 1.45, where many swing shorts would reassess.
Bullish invalidation: The bullish intraday scenario breaks down if XRP loses 1.37–1.35 on a sustained basis. A daily close under 1.35, especially if it coincides with a tag or break of the lower Bollinger band near 1.33 and a drop in daily RSI back toward the low 30s, would confirm that the bounce has failed and that the larger downtrend has resumed with force.
Clear bearish scenario for XRPUSDT
The higher timeframe already leans in favor of sellers; the question for bears is about timing and entry, not direction.
Bearish path: Bears want the intraday bounce to run out of steam under key resistance. The ideal script looks like this:
- Price stalls in the 1.39–1.41 zone (hourly 200 EMA, H1 R1, and just below the daily mid-BB).
- RSI on H1 rolls back toward 50 while daily RSI stays capped below 45.
- Price then slips back below 1.38 and 1.37, turning that pivot band from support into resistance.
From there, sellers would aim for the 1.35–1.33 zone, which aligns with daily S1 and the lower Bollinger band. If that area breaks on a daily close, the technical picture shifts from controlled downtrend to downtrend with expansion. In that case, daily ATR would likely pick up above 0.08 and panic-driven selling can appear.
Bearish invalidation: For the bearish structural view to be seriously challenged, XRP needs more than a short-term spike. You would want to see:
- A decisive move and close above 1.45 (the daily EMA20).
- Follow-through that starts to flatten and then lift the EMA20 itself.
- Daily RSI sustaining above 50 rather than being rejected around 45.
That kind of behavior would say the downtrend has at least paused, if not ended, and that mean reversion toward the 1.63 EMA50 is in play. Until then, every rally into the 1.40–1.45 area is technically a selling opportunity for trend followers.
Positioning, risk, and how to think about this tape
With the broader crypto market in Extreme Fear yet up on the day, the tape is fragile. Liquidity can vanish quickly in either direction. For XRP specifically, conditions remain nuanced across timeframes.
- The macro bias is still down on the daily: price under all key EMAs, low-40s RSI, and proximity to the lower Bollinger half confirm that.
- Short-term traders are trying to fade that pessimism intraday, as seen by the bullish 15-minute regime and elevated H1 RSI.
- The fight is concentrated around 1.37–1.40, which acts as the immediate control zone for both sides.
In this kind of structure, chasing either direction without respecting levels is where traders get chopped up. Breakouts that line up across timeframes, such as a move above 1.40 that coincides with strengthening daily momentum, or a break below 1.35 that pushes daily RSI back toward 30, carry much more weight than noise inside the range.
The key is to stay honest about the backdrop: until XRP reclaims its daily moving averages, any talk of a lasting trend reversal is premature. For now, the dominant force is still the daily downtrend, with intraday bounces offering tactical opportunities but also traps for anyone confusing a short squeeze with a new bull leg.


You May Also Like

Moscow Exchange prepares to start trading cryptocurrencies this year

Breaking Down Settlement Factors in Formula Injury Lawsuits

India Busts ₹226 Crore Crypto Network Linked to Drugs and Terror Financing


