

PUMP Price Crashes 22% as $99M in Capital Exits in 24 Hours
This article was first published on The Bit Journal.
PUMP price slid sharply over the past 24 hours as sellers tightened their grip on the market. The token, which powers the Pump.fun memecoin launchpad fell about 22.50% over the past week.
The latest move in PUMP price coincided with a steep drop in market value. Data showed that roughly $99.47 million left the token’s market within one day. Market capitalization fell from about $715 million to nearly $615 million during the same period.
PUMP Price Hit by Rising Selling Pressure
Trading volume increased while the token dropped. Rising turnover during a decline often signals determined selling. It suggests that traders are closing positions rather than adding exposure.
Derivatives data also turned more negative. Open Interest fell by 4% in 24 hours. Short positions dominated the remaining contracts, adding to the downside bias.
PUMP is the native token of Pump.fun, a launchpad focused on memecoins. The asset supports activity on the platform and is closely tied to trading and launch fees.
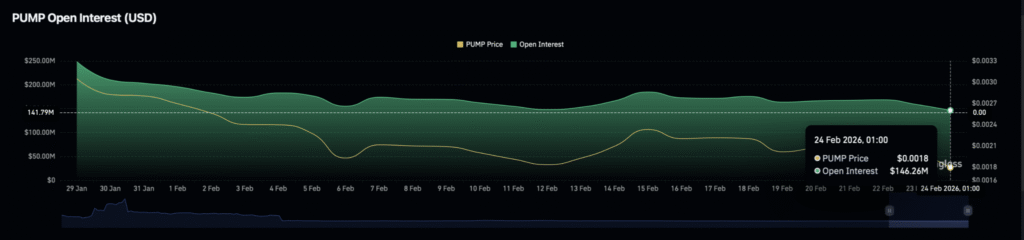 Source: CoinGlass
The most immediate concern is the scale of recent outflows. Nearly $100 million left the token’s market in a single session. The shift in capital was large relative to the total valuation.
Such rapid withdrawals reduce liquidity. Thin liquidity can magnify moves when selling picks up. For PUMP holders, this means larger swings and less room for error.
The fall in market cap reflects cooler sentiment and reduced risk appetite. It shows that some investors are not willing to wait for a rebound in PUMP price.
Trading Volume and Derivatives Signal Bearish Mood
Spot trading volume rose as the token dropped. That combination often points to strong sell-side conviction. Sellers appear motivated, while buyers are more cautious.
In derivatives, Open Interest slipped 4% over the same period. Capital left the futures market even as short exposure stayed high. About $146 million remained active in perpetual contracts.
The weighted average funding rate stood near -0.0054%. A negative rate means short traders are paying to keep positions open. This setup suggests that many traders expect further weakness in PUMP price.
| Month | Min. Price | Avg. Price | Max. Price | Change |
|---|---|---|---|---|
| Feb 2026 | $ 0.001223 | $ 0.001409 | $ 0.001789 |
4.74%
|
| Mar 2026 | $ 0.001304 | $ 0.001377 | $ 0.001435 |
-16.00%
|
| Apr 2026 | $ 0.001314 | $ 0.001367 | $ 0.001433 |
-16.09%
|
| May 2026 | $ 0.001201 | $ 0.001284 | $ 0.001351 |
-20.92%
|
| Jun 2026 | $ 0.001276 | $ 0.001309 | $ 0.001339 |
-21.62%
|
| Jul 2026 | $ 0.001324 | $ 0.001379 | $ 0.001450 |
-15.12%
|
| Aug 2026 | $ 0.001395 | $ 0.001420 | $ 0.001445 |
-15.42%
|
| Sep 2026 | $ 0.001387 | $ 0.001460 | $ 0.001635 |
-4.30%
|
| Oct 2026 | $ 0.001611 | $ 0.001920 | $ 0.002540 |
48.66%
|
| Nov 2026 | $ 0.002634 | $ 0.004059 | $ 0.005060 |
196.23%
|
| Dec 2026 | $ 0.004055 | $ 0.004173 | $ 0.004299 |
151.63%
|
PUMP Price Tests Critical Support Zone
At press time, the token traded near an important support band between $0.0067 and $0.0083. This range now acts as a key decision area on the chart.
If buyers fail to defend this zone, the decline could deepen. A break below support may open the door to a move toward roughly $0.0056. Those levels were last seen in December.
Even if a bounce emerges from the current area, the broader structure remains fragile. Strong selling after a modest rebound could form a lower high. That pattern often comes before another leg down in PUMP price.
Technical Indicators Point to Further Downside
Momentum tools back the cautious outlook. The Moving Average Convergence Divergence (MACD) indicator has formed a bearish crossover. Traders often call this pattern a “death cross.”
That signal points to weakening upside momentum and rising downside risk. It suggests that sellers still control the short-term trend. Without a clear shift in demand, the technical picture may stay negative.
If the current structure holds, pressure on PUMP price could continue. A decisive break below the existing support range would further damage sentiment.
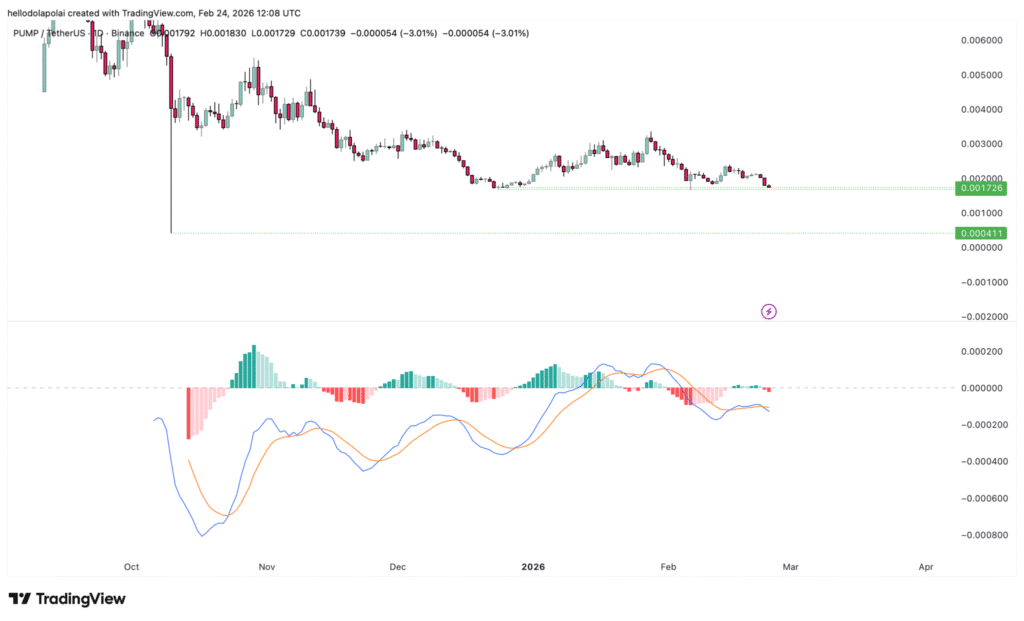 Source: TradingView
On-Chain Activity Shows User Slowdown
On-chain data presents another challenge. Figures from Artemis showed a sharp fall in daily active users on the platform. Active addresses dropped from about 180,000 to nearly 147,000, a decline of roughly 33,000.
Lower activity often means fewer transactions and weaker organic demand. For a token tied to platform usage, that trend is important. A persistent drop in users can make any recovery in PUMP price harder to sustain.
The slowdown also hints at softer community engagement. Fewer active participants may reduce liquidity and depth across markets linked to the token.
Launchpad Revenue Collapses
Launchpad metrics paint a bleak picture. The trading volume on the launchpad dropped to a level of $6,600. Fees fell to $0 on 23 February after peaking around $781,600 less than a month prior.
That drop in fee income points to a steep fall in new activity and deals. And it also eliminates a source of revenue for the ecosystem. Weaker fundamentals, for holders, cast doubt on long-term value.
Conclusion
PUMP price is under clear pressure as capital exits, derivatives turn bearish, and platform usage declines. The token now sits near a crucial support band that may define its next major move.
If buyers defend this region and on-chain activity stabilizes, a short-term relief rally is possible. However, continued outflows, weak fees, and falling user numbers could keep the outlook fragile. For now, data points to caution rather than quick recovery.
Appendix: Glossary of Key Terms
Capital Outflows: Money moving out of an asset or market over a defined time.
Trading Volume: The total amount of an asset that is traded in a designated period.
Open Interest: The total number of contracts that exist in an open position for derivatives.
Funding rate: The recurring payment between long and short traders in the perpetual futures markets.
Support Zone: A price range where buying interest could prevent a further drop.
Weak Bullish momentum: A technical signal that shows the end of upward price movement.
Liquidity: Being a buyer or seller of an asset and not moving the market.
Frequently Asked Questions About PUMP Price
1- What is driving the current PUMP price decline?
The decline is linked to heavy capital outflows, rising trading volume during a selloff, and bearish positioning in derivatives.
2- How much value left the market in the latest move?
Around $99.47 million exited the market in one day. This drop cut market capitalization from about $715 million to roughly $615 million.
3- Why does the support zone matter for the PUMP price?
The range between $0.0067 and $0.0083 marks a key area where buyers and sellers meet.
4- What do the negative funding rates mean?
Negative funding rates show that traders are paying to hold short positions.
References
AMBCrypto
Disclaimer
This article is for informational purposes only and does not constitute financial, investment, or trading advice. Cryptocurrency prices are highly volatile. Readers should conduct independent research and consult qualified financial professionals before making investment decisions.
Read More: PUMP Price Crashes 22% as $99M in Capital Exits in 24 Hours">PUMP Price Crashes 22% as $99M in Capital Exits in 24 Hours


You May Also Like

E.l.f. Beauty (ELF) Stock Surges Despite Disappointing Forward Guidance After Q4 Earnings Beat

Deere (DE) Stock Falls After Q2 Beat as Flat Farm Income Spooks Investors

Oman slashes budget deficit on higher hydrocarbon revenues


