

Bittensor price breaks out of falling wedge pattern: How high can TAO go?
Bittensor (TAO) has quietly returned to the spotlight after weeks of compressed price action and growing technical tension.
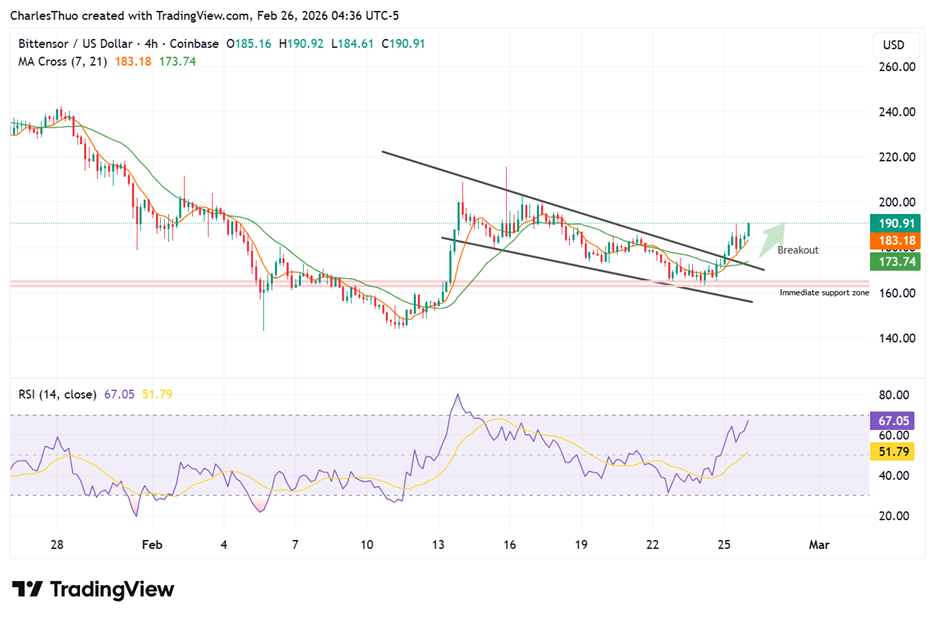
The TAO price has broken out from a falling wedge pattern on the 4-hour timeframe, a structure that often signals the end of a corrective phase.
 Bittensor price chart analysis | Source: TradingView
This breakout has shifted short-term sentiment from cautious to constructive, as buyers defended key support levels with conviction.
Notably, the move did not happen in isolation, as it followed a prolonged period of consolidation near the lower boundary of a broader descending channel.
That base-building phase allowed selling pressure to cool while stronger hands gradually absorbed supply.
As a result, the breakout carries more weight than a typical short-lived bounce.
Bittensor (TAO) price analysis
Bittensor (TAO) price has been trading well below its all-time high, reflecting a long correction.
However, despite the drawdown, price action over recent weeks suggests that downside momentum has weakened meaningfully.
The support around the $163 to $165 zone has repeatedly held, forming an accumulation shelf that traders have been watching closely.
Each dip into this area has been met with steady buying rather than panic selling.
The falling wedge breakout adds confirmation that buyers are regaining control, at least in the short term.
Falling wedges typically form when sellers lose strength over time, even as the price continues to drift lower.
When price breaks above the upper boundary, it often marks the start of a recovery leg rather than the end of a rally.
That is exactly the setup TAO is now presenting.
If momentum continues and broader market conditions remain stable, the structure supports a continuation move higher.
The key resistance levels to watch in the short term
The first area of interest sits near the mid-range of the broader descending channel.
This zone represents the first real test for the breakout, as previous rallies stalled there.
If the token breaks here it would open the door toward the descending resistance near the $230 to $240 region.
That level aligns with previous rejection points and carries strong technical significance.
From current levels, a move into that range would translate into a gain of roughly 25% to 40%.
Such a move would be well within reason, given the size of the wedge and the duration of consolidation.
However, the upside move is not guaranteed, and momentum must be sustained to keep the recovery thesis intact.
A failure to hold above broken resistance could turn the breakout into a false signal.
If price slips back below the wedge structure, confidence in the bullish setup would weaken quickly.
In that case, attention would shift back toward lower support zones.
The risk factors that could slow the rally
While the technical picture has improved, TAO is still trading below key long-term moving averages on the higher timeframes, suggesting that the broader trend remains cautious rather than fully bullish.
Also, the short-term strength does not automatically translate into a long-term trend reversal.
Wider market conditions also matter, especially Bitcoin’s price movements and overall risk appetite.
A sharp downturn across the crypto market could cap TAO’s upside regardless of its internal structure.
That said, the current setup favours patience.
The TAO price is no longer showing the same aggressive selling pressure seen earlier in the year.
Instead, it is behaving like an asset in recovery mode.
If buyers continue to defend support and push the price higher step by step, the breakout could evolve into something more meaningful.
For now, TAO appears to have room to climb, as long as the structure it has built remains intact.
The post Bittensor price breaks out of falling wedge pattern: How high can TAO go? appeared first on Invezz
You May Also Like

WTI Oil Prices Achieve Remarkable Stability as US-Iran Tensions Counter Record US Crude Inventory Surge

Tether CEO Delivers Rare Bitcoin Price Comment
