

Bitcoin Price Warning: Why a 50% Crash Could Be Unstoppable?
Bitcoin price is sitting on shaky ground. The latest ISM manufacturing data shows the US economy grinding through its sixth straight month of contraction, while tariffs, higher costs, and a crippling tax burden weigh heavily on businesses and households alike. For a risk asset like BTC price, this backdrop is toxic. The chart is already flashing weakness, and if these conditions persist, the probability of a crash exceeding 50% is no longer far-fetched—it’s a very real risk.
Bitcoin Price Prediction: Manufacturing Contraction and Economic Weakness
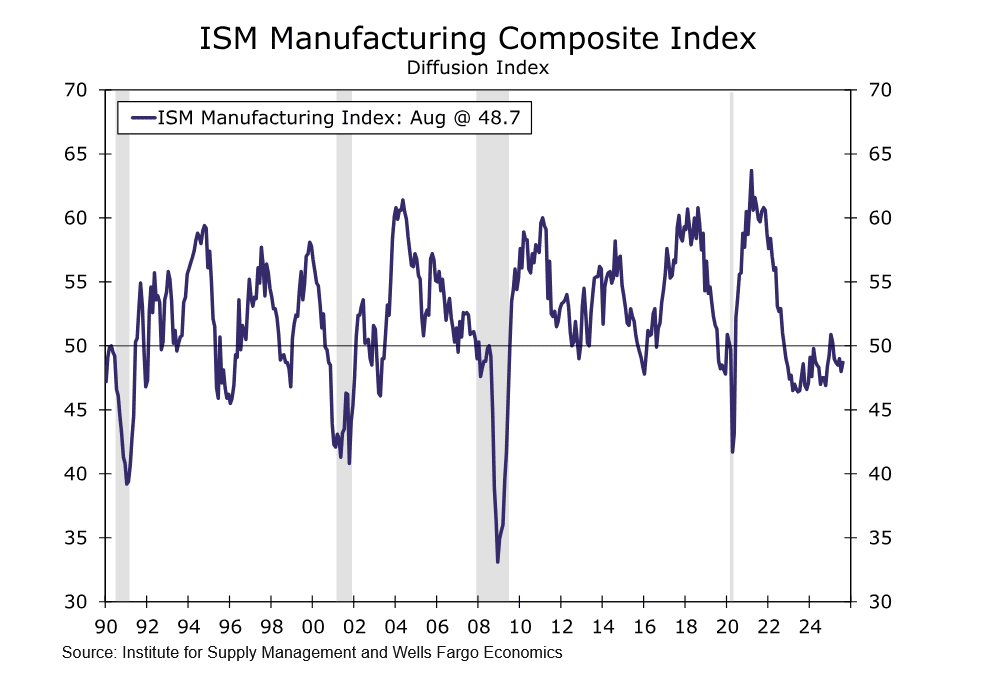
The ISM manufacturing index at 48.7 tells us the US manufacturing sector has been in contraction for six straight months. Manufacturing is a core driver of economic cycles. When it weakens, it usually signals a slowdown in broader economic growth. Even though new orders ticked up, production fell sharply, delivery times are longer, and inventories are rising.
This suggests companies are producing less, sitting on more stock, and facing clogged supply chains. Historically, such conditions align with risk-off behavior in financial markets, where investors flee from risk assets like Bitcoin price.
Tariffs, Costs, and Pessimism
Manufacturers are trapped in tariff uncertainty. Higher material costs, unpredictable trade policies, and sourcing issues are reducing investment in new equipment and forcing layoffs. This is more than just a sectoral problem—it feeds into broader economic pessimism. When businesses pull back, capital markets tighten. Bitcoin thrives in liquidity-rich, high-risk environments. If tariffs and trade wars push investors into defensive assets, BTC demand could dry up quickly.
The Burden of Taxes and Compliance Costs
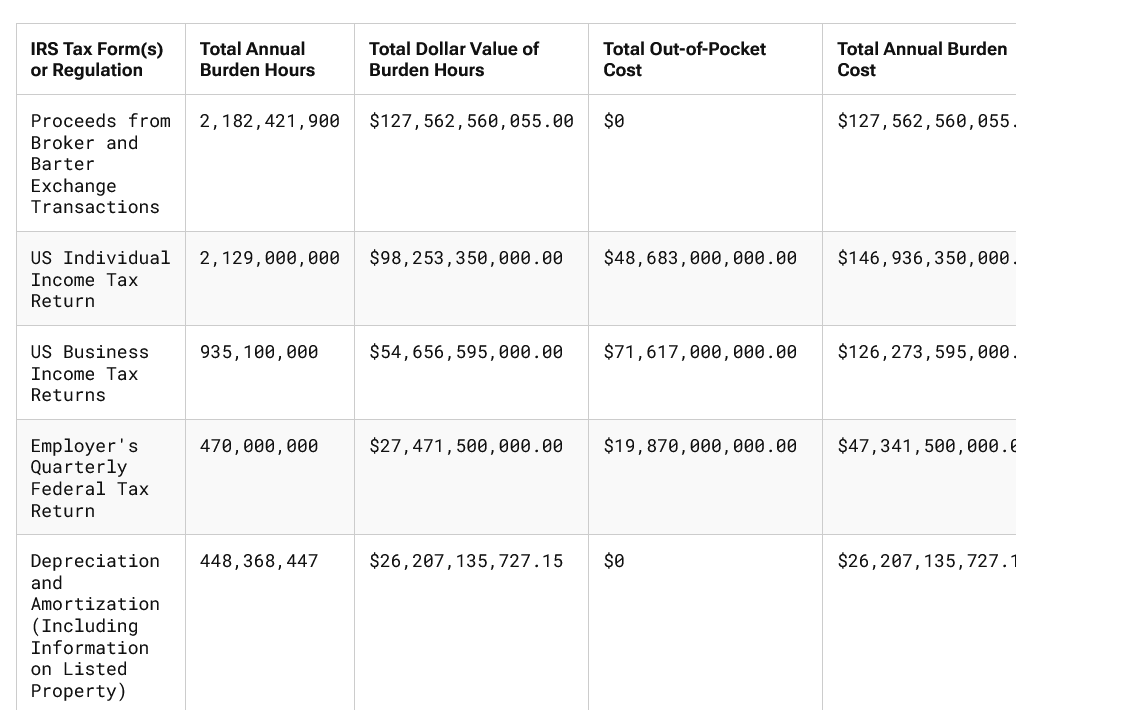 America's Tax Compliance Burden in 2025: Source: Tax Foundation
According to the Tax Complexity report from Tax Foundation, the tax code analysis adds another layer. In 2025, Americans will spend 7.1 billion hours on tax compliance, costing the economy around $536 billion—nearly 2 percent of GDP. That’s a massive drag on productivity and consumption. Pair this with elevated interest rates and a sluggish manufacturing base, and you have an economy losing growth momentum. For Bitcoin price, this means less disposable income flowing into speculative investments. Retail demand, one of Bitcoin price core supports, could collapse.
Bitcoin Price Prediction: What the BTC Price Chart Says?
 BTC/USD Daily Chart- TradingView
Looking at the BTC daily chart:
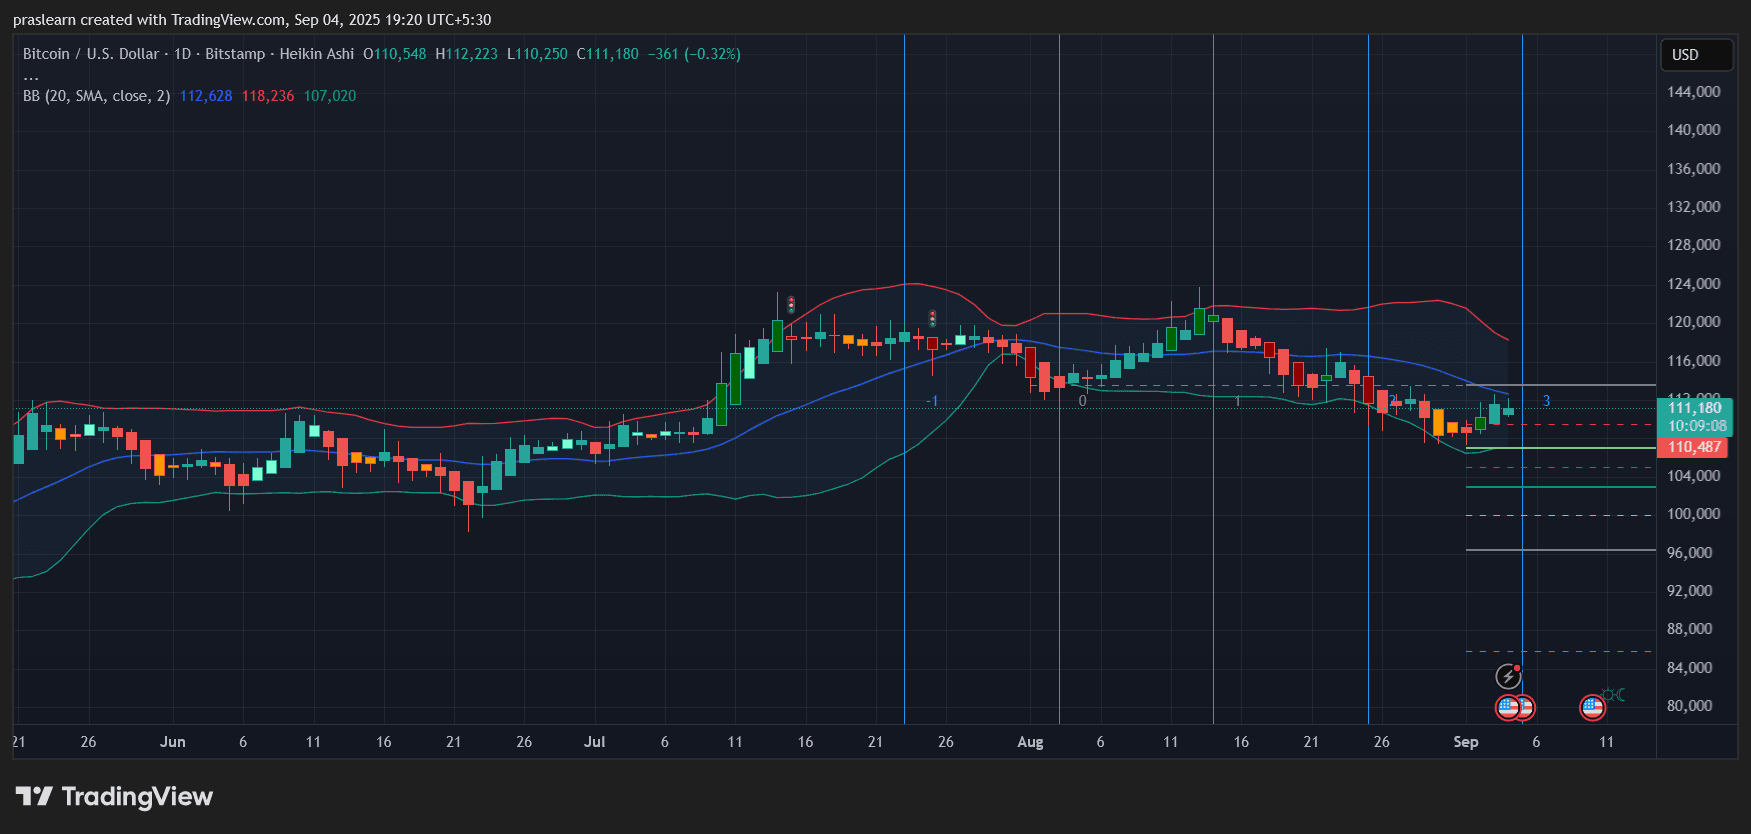
Bitcoin Price is trading at $111,180, hovering near the midline of the Bollinger Bands. Since mid-July, BTC has been trending downward from the $124,000 peak. It briefly tested support around $107,000 and is now consolidating just above that zone. The Bollinger Bands are narrowing, showing compression that often precedes a sharp move.
If BTC price fails to hold $107,000, the next clear support levels are at $100,000, $96,000, and then $88,000. A break of these would confirm a bearish cascade.
A drop to the lower end of the projected supports (around $80,000–$85,000) would mean it will be on the path of decline of more than 50% from recent highs.
Bitcoin Price Prediction: Why a 50% Crash Is Plausible?
If economic contraction deepens: Institutional investors will reduce exposure to speculative assets. Retail demand will shrink under higher living costs and tax burdens.
Tariff uncertainty will continue to hurt business sentiment, dragging equity markets lower. Bitcoin, correlated with tech and growth assets, will follow.
From a technical perspective, $Bitcoin price is already in a descending structure. Breaking $107,000 could trigger panic selling.
Conclusion
The ISM report, combined with tax burdens and high interest rates, paints a picture of an economy under stress. Bitcoin price chart is not showing resilience but vulnerability, with multiple weak supports ahead. If conditions remain the same—manufacturing in contraction, tariffs unresolved, and tax drag in place $BTC could easily crash by 50% or more in the coming months. The $80,000–$85,000 zone looks like a realistic target if macro conditions deteriorate further.


You May Also Like

Iran’s foreign minister targeted in assassination attempt, wife killed

Galaxy Digital Files First Nasdaq Annual Report, Targets $15 Billion AI Data Center Expansion – Crypto News Bitcoin News


