

Gold Price Plummets Below $5,100 as Soaring Dollar and Yields Spark Market Turmoil
BitcoinWorld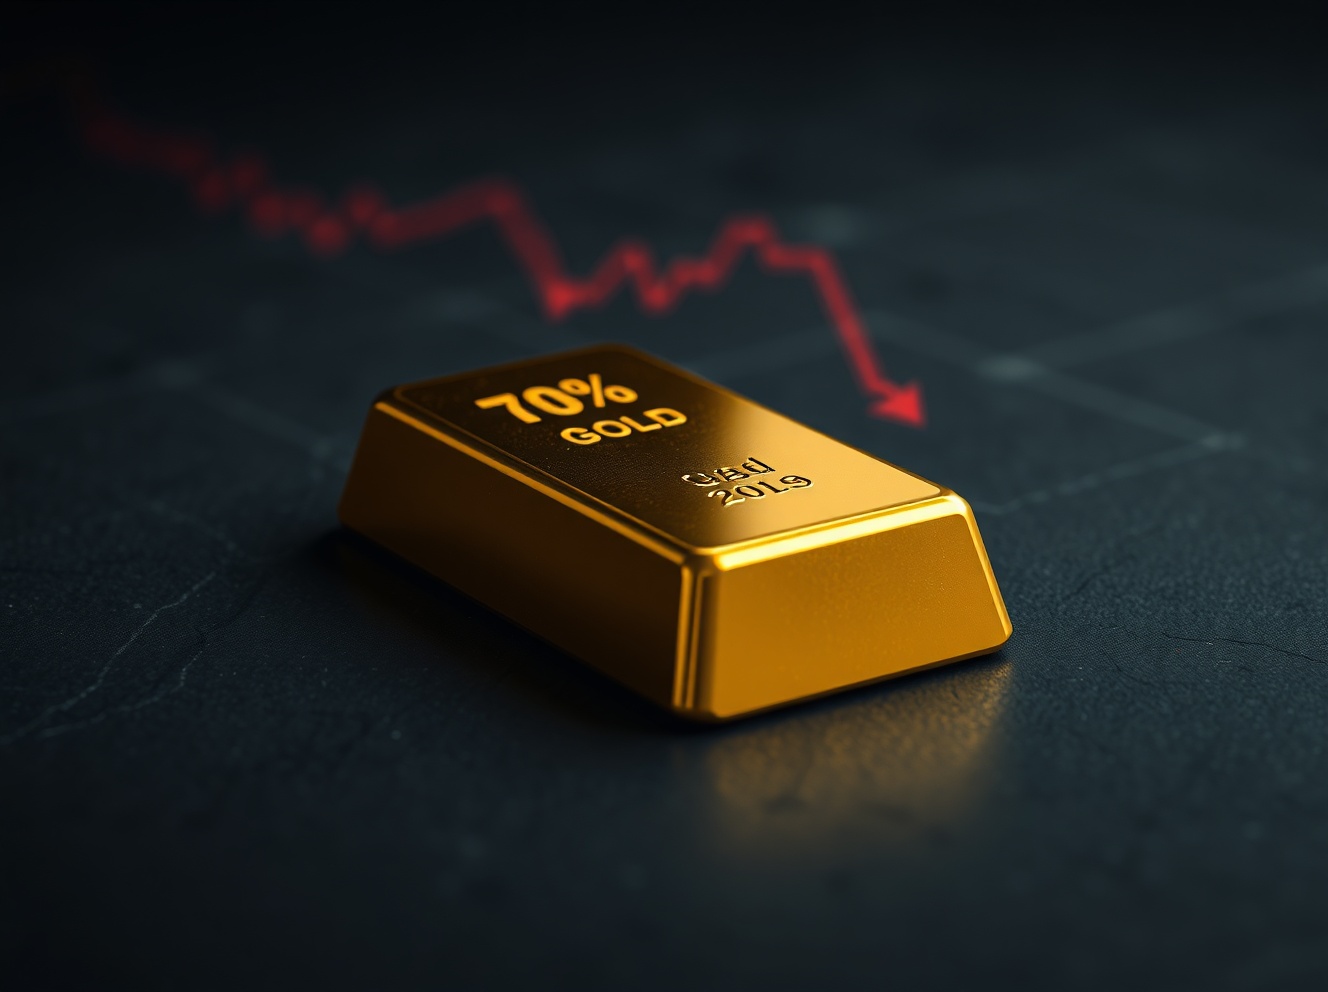
Gold Price Plummets Below $5,100 as Soaring Dollar and Yields Spark Market Turmoil
In a significant market shift, the spot price of gold has tumbled decisively below the $5,100 per ounce threshold, marking a stark reversal for the precious metal. This dramatic gold price movement, observed in global trading sessions, stems primarily from concurrent strength in the US Dollar and a sharp climb in US Treasury yields. Consequently, market analysts are scrutinizing the implications for inflation hedges and portfolio allocations.
Gold Price Breakdown: Analyzing the $5,100 Support Level
The breach of the $5,100 level represents a critical technical and psychological defeat for gold bulls. Historically, this zone has acted as a robust support area during previous consolidations. Market data from major exchanges shows sustained selling pressure accelerated once this level gave way. Furthermore, trading volumes spiked significantly, confirming the bearish sentiment. This price action suggests a potential re-evaluation of gold’s near-term trajectory by institutional investors.
Several key factors contributed to this breakdown. First, algorithmic trading models likely triggered sell orders upon the breach. Second, stop-loss orders clustered around $5,100 were executed, fueling the downward momentum. Finally, the shift in market structure indicates a change in the dominant narrative surrounding non-yielding assets. This confluence of events created a perfect storm for the precious metal.
The Dual Pressure: US Dollar Strength and Rising Yields
The primary catalysts for gold’s decline are twofold and deeply interlinked. Firstly, the US Dollar Index (DXY) has rallied to multi-month highs against a basket of major currencies. A stronger dollar makes dollar-denominated commodities like gold more expensive for holders of other currencies, dampening international demand. This dynamic creates immediate headwinds for the metal’s price.
Secondly, and perhaps more critically, US Treasury yields have surged across the curve. The benchmark 10-year yield, a key global financial barometer, has climbed substantially. Higher yields increase the opportunity cost of holding gold, which pays no interest. Investors therefore often rotate capital into government bonds when yields become attractive, seeking both safety and income. This fundamental relationship exerts persistent pressure on gold valuations.
Expert Analysis on Monetary Policy Impact
Financial strategists point to shifting expectations around Federal Reserve policy as the root cause. Recent economic data, particularly concerning inflation and employment, has led markets to anticipate a more hawkish stance from the central bank. “The market is repricing the timeline for potential rate cuts,” notes a senior analyst from a major investment bank. “This recalibration directly boosts the dollar and real yields, creating a hostile environment for gold.” This expert perspective underscores the macro-driven nature of the sell-off.
Historical Context and Comparative Market Performance
To understand the current move, it is instructive to examine historical precedents. Periods of synchronized dollar strength and yield increases have consistently pressured gold. For instance, similar dynamics were observed during the 2013 “Taper Tantrum” and phases of aggressive Fed tightening cycles. The table below illustrates key comparative periods:
| Period | DXY Change | 10-Yr Yield Change | Gold Price Reaction |
|---|---|---|---|
| 2013 (May-Aug) | +4.5% | +100 bps | -20% |
| 2022 (Mar-Jun) | +6.8% | +120 bps | -15% |
| Current Move | +5.2% (YTD) | +80 bps (Recent) | -12% (From Peak) |
This comparative analysis reveals a clear pattern. While the magnitude varies, the directional relationship remains robust. Other asset classes have reacted divergently. Notably, equity markets have shown resilience, while cryptocurrencies have experienced correlated volatility, highlighting gold’s shifting role in risk-off scenarios.
Broader Impacts on Commodity and Currency Markets
The fallout from gold’s decline extends beyond the precious metals complex. Firstly, other commodities, particularly silver and platinum, have also faced selling pressure, though their industrial demand provides some offset. Secondly, currencies of major gold-producing nations, like the Australian Dollar (AUD) and Canadian Dollar (CAD), have shown sensitivity to the move. Central bank reserves, which hold significant gold, may see paper losses, potentially influencing their asset management strategies.
Key impacts include:
- ETF Outflows: Major gold-backed exchange-traded funds (ETFs) have reported consistent daily outflows, reflecting retail and institutional divestment.
- Mining Equity Pressure: Shares of gold mining companies have underperformed the spot price decline due to operational leverage concerns.
- Options Market Shift: The pricing of gold options indicates traders are hedging for further downside or increased volatility.
These market mechanics demonstrate the widespread ripple effects of the core price movement.
Future Outlook: Key Levels and Catalysts to Watch
The immediate technical focus now shifts to the next major support zone around $4,950-$5,000 per ounce. A sustained break below this area could open the path for a deeper correction. Conversely, a recovery above $5,150 would be needed to stabilize the short-term trend. Market participants will closely monitor several upcoming catalysts.
Critical data points include:
- Upcoming US Consumer Price Index (CPI) and Producer Price Index (PPI) reports.
- Federal Open Market Committee (FOMC) meeting minutes and official statements.
- US Treasury auction results, which directly influence yield levels.
- Geopolitical developments that could reignite safe-haven demand.
The interplay between these factors will determine whether the current pressure persists or abates.
Conclusion
The gold price decline below $5,100 serves as a powerful reminder of the metal’s sensitivity to global macroeconomic forces, particularly US Dollar strength and Treasury yield movements. This event underscores the challenging environment for non-yielding assets amid shifting central bank expectations. While long-term fundamentals for gold, including its role as a diversifier, remain intact, the near-term path hinges on incoming economic data and policy signals. Market participants must now navigate a landscape where traditional correlations are being tested, making vigilant analysis of the core drivers—the dollar and yields—more crucial than ever for understanding the future direction of the gold price.
FAQs
Q1: Why does a strong US Dollar cause gold prices to fall?
A stronger US Dollar makes gold more expensive for buyers using other currencies. This typically reduces international demand, placing downward pressure on its dollar-denominated price.
Q2: What is the relationship between Treasury yields and gold?
Gold offers no yield or interest. When Treasury yields rise, the opportunity cost of holding gold increases because investors can earn interest from safe government bonds instead, making gold less attractive.
Q3: Is gold still considered a safe-haven asset during this sell-off?
Yes, but its short-term performance can be overwhelmed by dominant macro trends like rising real yields and dollar strength. Its safe-haven status is often more pronounced during equity market crises or geopolitical shocks rather than during pure monetary policy tightening phases.
Q4: What price level is now critical for gold after breaking below $5,100?
Technical analysts are watching the $4,950-$5,000 region as the next major support zone. A hold above this area could signal consolidation, while a break below may indicate further downside.
Q5: How are gold mining stocks affected by this price drop?
Gold mining stocks are typically more volatile than the metal itself. A falling gold price squeezes profit margins, often causing mining equities to decline more sharply than the spot price due to their operational and financial leverage.
This post Gold Price Plummets Below $5,100 as Soaring Dollar and Yields Spark Market Turmoil first appeared on BitcoinWorld.


You May Also Like
‘Effectively Over’: Trader James Wynn Calls Time on the Memecoin Market

Soluna Closes $53M Briscoe Wind Farm Acquisition; Achieves Vertical Integration

CME Group to Launch Solana and XRP Futures Options



