

Bitcoin ETFs Post $227.83M Net Outflows, Weekly Net Inflows At $917.28M
Key Insights:
- Bitcoin ETFs posted net outflows of $227.83M on Thursday as BTC price continued to coil between $70,000 and $71,000
- US crypto spot ETFs posted net outflows of $328.22M, with only LINK spot ETFs posting net inflows.
- US BTC demand dips as BTC nears potential pre-bottom dump; liquidation heatmap highlights a higher concentration of leverage between $71K and $72K.
Bitcoin spot exchange-traded funds (ETFs) reported net outflows of $227.83 million on Thursday. At the same time, the BTC price held its own below the $71,000 mark. BlackRock (NASDAQ: IBIT) led outflows with a $88.74 million sell-off.
BTC price hovered below the $71,000 mark on Thursday, and as of early Friday, it stayed near that zone. Analyst Ted Pillows has repeatedly warned that BTC is heading for the bear market bottom. He also warned that the latest surge is not a bullish signal.
BTC ETFs Break Three-day Net Inflow Streak
On Thursday, apart from IBIT, five other BTC ETFs reported outflows. Fidelity (CBOE: FBTC) posted $48.03 million in outflow, and Bitwise (NYSE: BITB) shed $46.38 million.
Following this, Ark 21Shares (CBOE: ARKB) shed $22.67 million, and Grayscale (NYSE: GBTC) posted outflows of $18.88 million. Also, VanEck (CBOE: HODL) marked outflows of $8.55 million.
Meanwhile, Valkyrie (NASDAQ: BRRR) was Thursday’s sole buyer; BRRR reported an inflow of $5.42 million. Five funds reported zero flows. With Thursday’s net outflows, Bitcoin ETFs broke a three-day net inflow streak and marked March’s first daily net outflow.
 Bitcoin ETFs daily net flows as of March 5th, 2026 | Source: SoSoValue
Weekly net inflows stand at $917.28 million; one more trading day remains (Friday) this week. This is the biggest daily net outflow since February 12th ($410.37M).
Overall, US crypto spot ETFs reported combined net outflows of $328.22 million. Ethereum (ETH) spot ETFs shed $90.94 million; XRP spot ETFs reported $6.15 million in net outflows.
Solana (SOL) spot ETFs posted $5.23 million in net outflows. Also, Chainlink (LINK) spot ETFs posted $1.93 million in net inflows.
Bitcoin Hovers Below $71,000, Coiling For a Pre-Bottom Dump
BTC price’s stellar rise beyond $70,000 has been one of the most exciting price activities in crypto since Late February. However, this rise has largely been explained by the sell-pressure exhaustion.
Bitcoin’s true bear-market bottom has yet to surface. Furthermore, hovering below $71,000 isn’t exactly seen as a sign of consolidation.
BTC has shown little volatility since yesterday, holding up above the $70,000 mark. Notably, the Coinbase Bitcoin premium index showed negative values on March 6th.
The index displays the difference in BTC price on Coinbase and the average of BTC price across all other centralized exchanges.
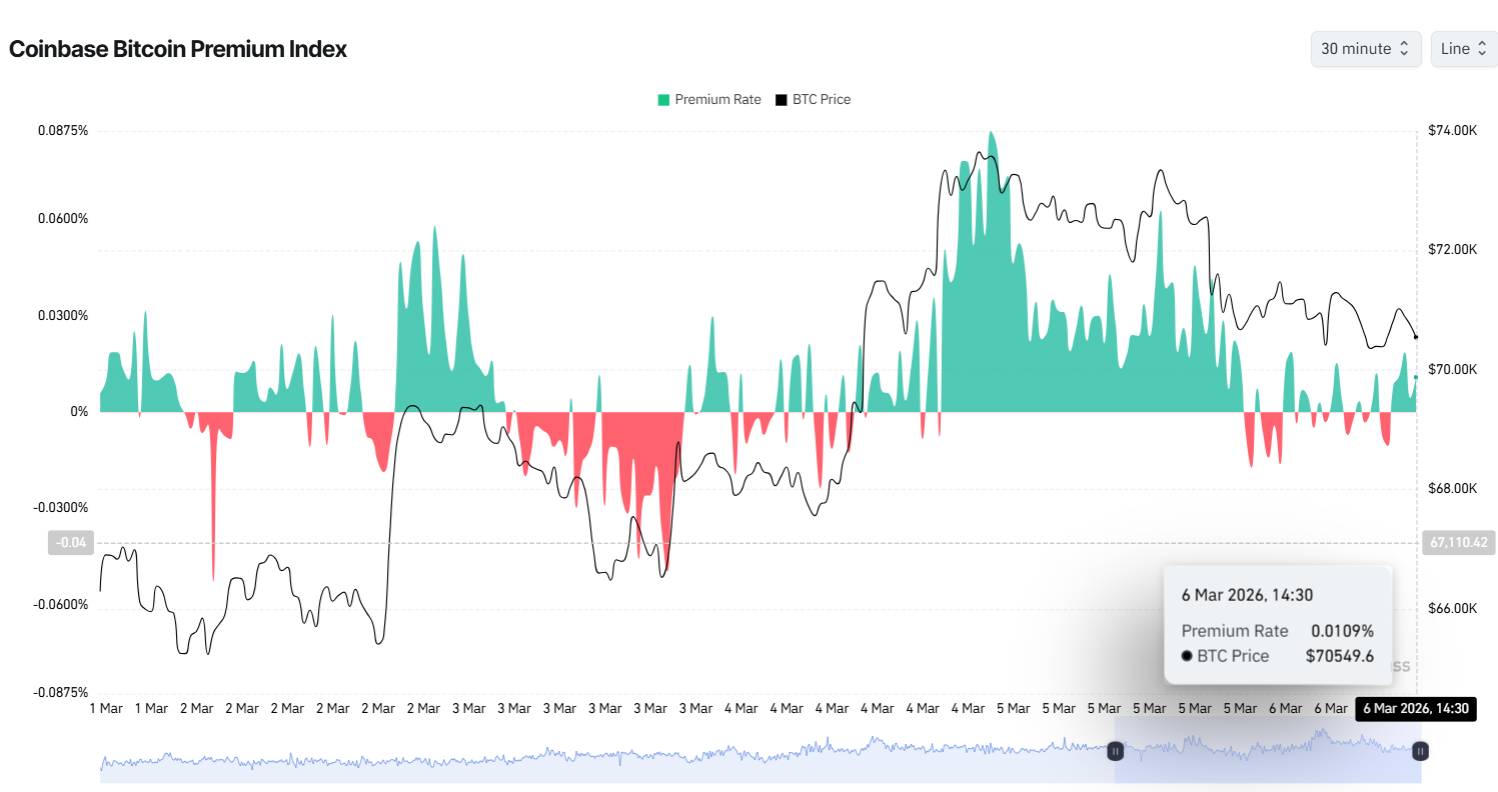 Coinbase Bitcoin Premium Index | Source: Coinglass
March 4th and 5th were largely characterized by green values. This meant that the BTC was trading at a premium on Coinbase on these two days. As of March 6th, the demand seems to be slowing.
 BTC Liquidation Heatmap: the bright yellow spots mark high leverage zones | Source: Coinglass
Analyst Ted Pillows has repeatedly warned that Bitcoin will likely drop sharply before reaching its bear-market bottom. Bitcoin’s liquidation heatmap provided by Coinglass shows leverage concentration between $71,000 and $72,000.
The post Bitcoin ETFs Post $227.83M Net Outflows, Weekly Net Inflows At $917.28M appeared first on The Market Periodical.


You May Also Like

Rape joke by Bacolod broadcaster sparks outrage, suspension

SelfCAD Bridges the Gap to Professional Design with Upcoming Gemini AI Integration

SGX FX Partners With Chainlink to Bring OTC FX Data Onchain


Trending News
More
