

Ethereum (ETH) Price: Technical Analysis Points to Potential Drop to $3,550 Level
TLDR
- ETH price has formed lower highs and lows since reaching ATH of $4,950 on August 14
- Declining spot buying and ETH ETF outflows signal weakening demand
- Ethereum futures open interest dropped 18% from ATH of $70 billion on August 23
- Network fees and revenue decreased despite price rally, partly due to Dencun upgrade
- Ethereum dominates stablecoin market with $165 billion supply (57% market share)
Ethereum’s price has been struggling to break through the $4,500 resistance level for over 10 days, despite reaching an all-time high of $4,950 on August 14. The second-largest cryptocurrency by market cap has formed a series of lower highs and lower lows on the daily chart, suggesting a potential downward trend.
The main factor capping Ethereum at $4,500 appears to be a lack of buyers. Data shows negative net spot buying on exchanges even as ETH price consolidates. Without real demand, any breakout attempt might lack the strength required to push ETH above key levels.
Spot Ethereum ETF demand has also weakened considerably. These investment products posted outflows every day last week, with Friday alone seeing Ethereum ETFs shed $446.8 million. Total outflows for the week reached $787.6 million, indicating institutional investors may be pulling back.
The derivatives market tells a similar story. Decreased demand for leverage resulted in a sharp drop in Ethereum futures open interest, which fell by 18% to $58 billion from an all-time high of $70 billion on August 23.
Market analysis suggests ETH could potentially drop further. A descending triangle pattern has formed on the daily chart, which often signals a bearish reversal after a strong uptrend. If the price breaks below the triangle’s support line at $4,200, it could continue downward toward $3,550, representing an 18% decline from current levels.
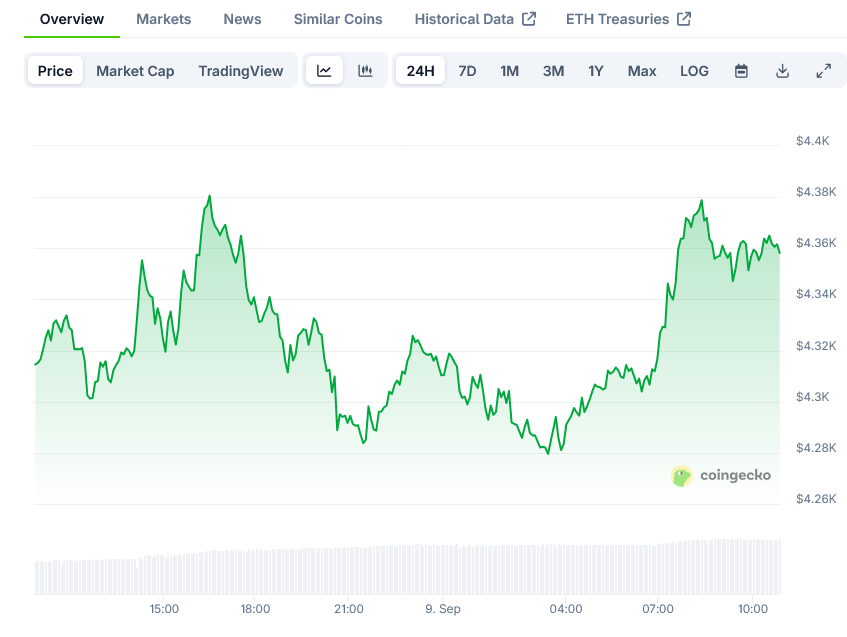 Ethereum Price on CoinGecko
Declining Network Activity
Ethereum’s network metrics have also shown concerning signs. Revenue from network fees dropped by about 44% in August, even as the price hit all-time highs. August revenue totaled just over $14.1 million, down from July’s $25.6 million.
This revenue decline occurred despite ETH rallying by 240% since April. Network fees have fallen approximately 10% over the last 30 days to about $43.3 million.
A large part of Ethereum’s revenue drop resulted from the Dencun upgrade in March 2024, which lowered transaction fees for layer-2 scaling networks using Ethereum as a base layer. This change has cut fee revenue and impacted ETH’s deflationary mechanism, potentially weakening its price momentum.
Some analysts remain optimistic despite these indicators. Investor and trader Ted Pillows noted that ETH price is “looking strong” above $4,200, though he added that a deeper drop to retest the $3,800-$3,900 range was possible before a reversal.
Stablecoin Dominance
Despite price struggles, Ethereum has reached a historic milestone in the stablecoin market. The network recorded a record supply of stablecoins, adding about $5 billion in new stablecoins in the past week alone.
This influx increased Ethereum’s overall stablecoin market to $165 billion, representing 57% of the total stablecoin market. Ethereum’s closest competitor, Tron, holds only 27% of the market, while Solana trails far behind with less than 4%.
Ethereum has also dominated the tokenized assets market. The network currently hosts tokenized gold valued at $2.4 billion. Since the beginning of 2024, the amount of tokenized gold has more than doubled, highlighting Ethereum’s growing role in the tokenized commodities market.
The network controls 77% of the tokenized commodities market, which grows to 97% when including the layer-2 Polygon network. Additionally, more than 70% of the market for tokenized US Treasuries runs on Ethereum.
This expansion into tokenized financial products has helped push Ethereum prices up significantly. Since April 2024, ETH has seen its price rise an impressive 200% from its previous levels.
Institutional adoption continues to grow as major financial organizations turn to Ethereum for tokenization. Fidelity, the third largest asset manager globally, recently launched an Ethereum blockchain-based asset fund that trades US Treasuries algorithmically.
Fidelity’s Digital Interest Token (FDIT), launched on September 1, has already accumulated $203.6 million in assets. This move demonstrates that institutional investors view Ethereum as neutral and dependable for financial applications.
The current price of Ethereum stands at $4,358 as it continues to consolidate below the $4,500 resistance level.
The post Ethereum (ETH) Price: Technical Analysis Points to Potential Drop to $3,550 Level appeared first on Blockonomi.


You May Also Like

Why Stablecoins Don’t Work Without Boring Infrastructure

Reagan adviser: Trump's 'shambolic' admin threatens the republic


