

Solana (SOL) Price Surges Past $90 as Short Sellers Face Major Losses
TLDR
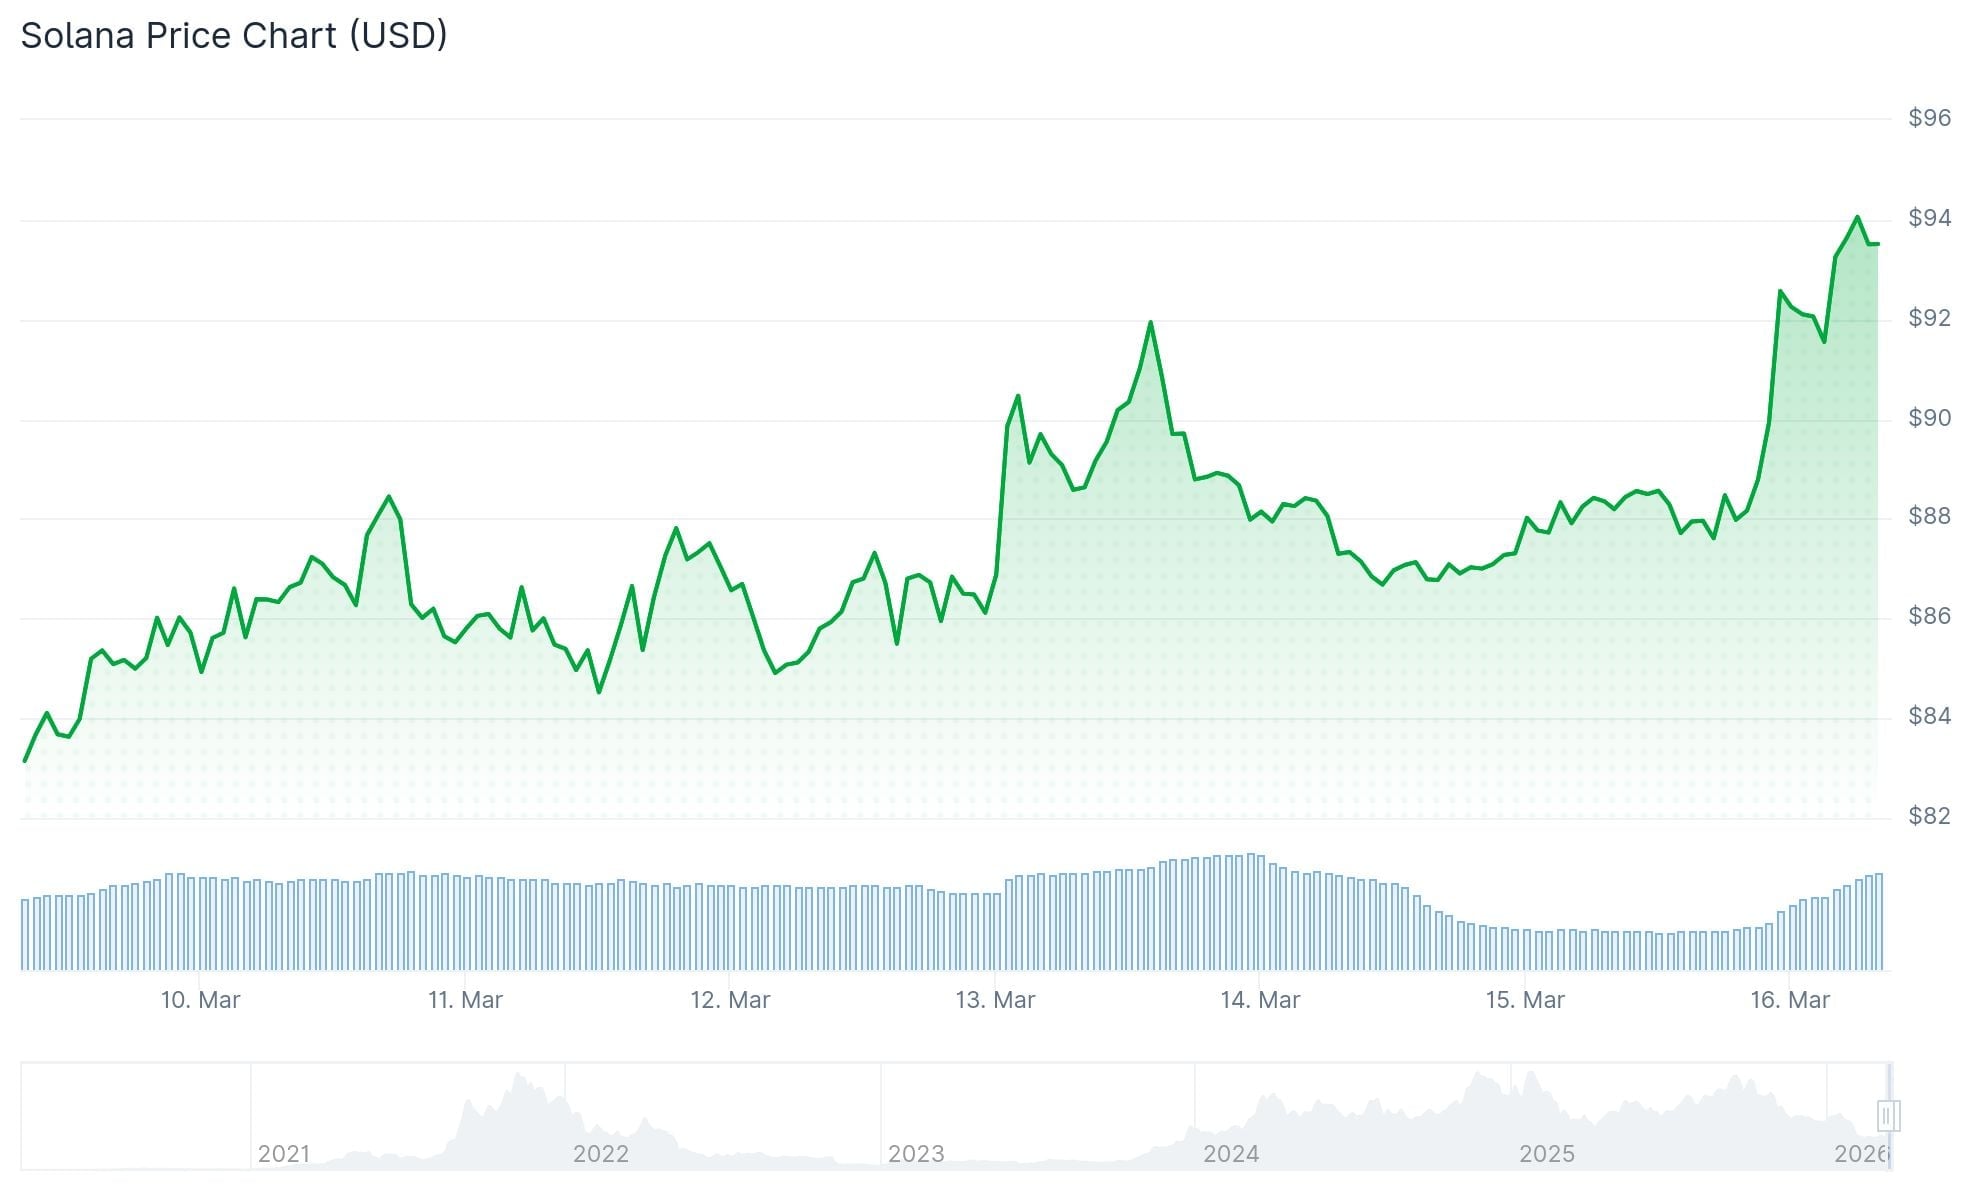
- SOL has climbed to the $92–$93 range, posting gains of approximately 4–5% daily following a 13% weekly increase.
- Institutional demand persists with SOL-focused ETFs recording $10.70 million in net weekly capital inflows.
- Futures Open Interest surged more than 7% within 24 hours to reach $5.57 billion, accompanied by $14.43 million in bear position liquidations.
- The 50-day EMA at $94.17 represents immediate technical resistance, with the 100-day EMA at $109.58 serving as the subsequent upside target.
- Real-world asset tokenization on the Solana network has expanded to approximately $873 million, based on Bitwise data.
Solana is demonstrating a notable rebound following its steep correction from the January 2026 high near $295. The digital asset has accumulated approximately 13% in gains throughout the past seven days and currently hovers within the $92–$93 price zone.
 Solana (SOL) Price
Exchange-traded funds dedicated to SOL accumulated $7.60 million in a single trading session on Friday, elevating the seven-day aggregate to $10.70 million. This sustained capital influx demonstrates persistent institutional appetite despite the recent downward pressure on prices.
Within the derivatives market, futures Open Interest experienced an upward movement exceeding 7% over a 24-hour period, reaching $5.57 billion. Bearish traders absorbed substantial losses, with short liquidations accounting for $14.43 million of the total $15.50 million in forced position closures.
The present trading level remains marginally beneath the 50-day Exponential Moving Average positioned at $94.17. Successfully closing above this threshold on a daily timeframe could establish momentum toward the 100-day EMA target of $109.58.
Technical momentum signals are exhibiting bullish tendencies. The MACD indicator has crossed into positive territory while the RSI registers at 58, positioned above neutral levels.
Real-World Asset Growth Supports Solana’s Case
Among the most compelling narratives supporting SOL’s price recovery is the expansion of tokenized real-world assets on its blockchain infrastructure. Bitwise research indicates that RWAs on Solana have reached approximately $873 million in valuation, spanning on-chain treasury products, private credit instruments, and yield-generating assets.
Spot-based Solana ETFs, which received regulatory approval in late 2025, have maintained capital attraction even throughout periods of adverse price movement. These investment vehicles provide traditional financial market participants with SOL exposure without the complexities of direct cryptocurrency custody.
Blockchain metrics corroborate this institutional interest. Active wallet addresses have exceeded the 5 million threshold while daily transaction volume approaches 87 million.
Network and Supply Context
The Solana validator network has expanded to encompass more than 2,000 validators according to certain estimates, though the count of active validators may be closer to 795. The Solana Foundation’s proportion of staked SOL tokens has declined substantially from above 40% in 2020 to below 6% by late 2025.
The network operates with an annual inflation rate of approximately 4%. Roughly 67% of SOL tokens remain staked, effectively constraining the freely circulating supply available for trading.
Funding rates across perpetual swap contracts remain relatively neutral to marginally negative at approximately −0.0095% daily. This metric indicates that leveraged long positions have not yet entered an aggressive accumulation phase.
Immediate downside support is identified within the $76–$80 range. Significant overhead resistance persists near $245–$250, corresponding to the January peak formation.
Presently, SOL exchanges hands at approximately $92–$93 with the 50-day EMA at $94.17 functioning as the immediate technical barrier.
The post Solana (SOL) Price Surges Past $90 as Short Sellers Face Major Losses appeared first on Blockonomi.


You May Also Like
Bitcoin Slips Below $79K as Surging Bond Yields and Inflation Fears Trigger Broad Market Sell-Off

Metaplanet buys 5,075 Bitcoin in Q1 to become 3rd-largest treasury


