

Dogecoin (DOGE) Price: The Falling Wedge That Has Traders Paying Attention
TLDR
- DOGE is forming a falling wedge pattern on the daily chart, which has historically preceded large price moves.
- Short-term resistance sits at $0.105–$0.11, aligned with key Fibonacci retracement levels.
- The RSI has recovered from oversold territory and is approaching neutral, with a small bullish signal.
- The 50-day EMA remains a bigger barrier above current prices, and reclaiming it would be the first real sign of a trend shift.
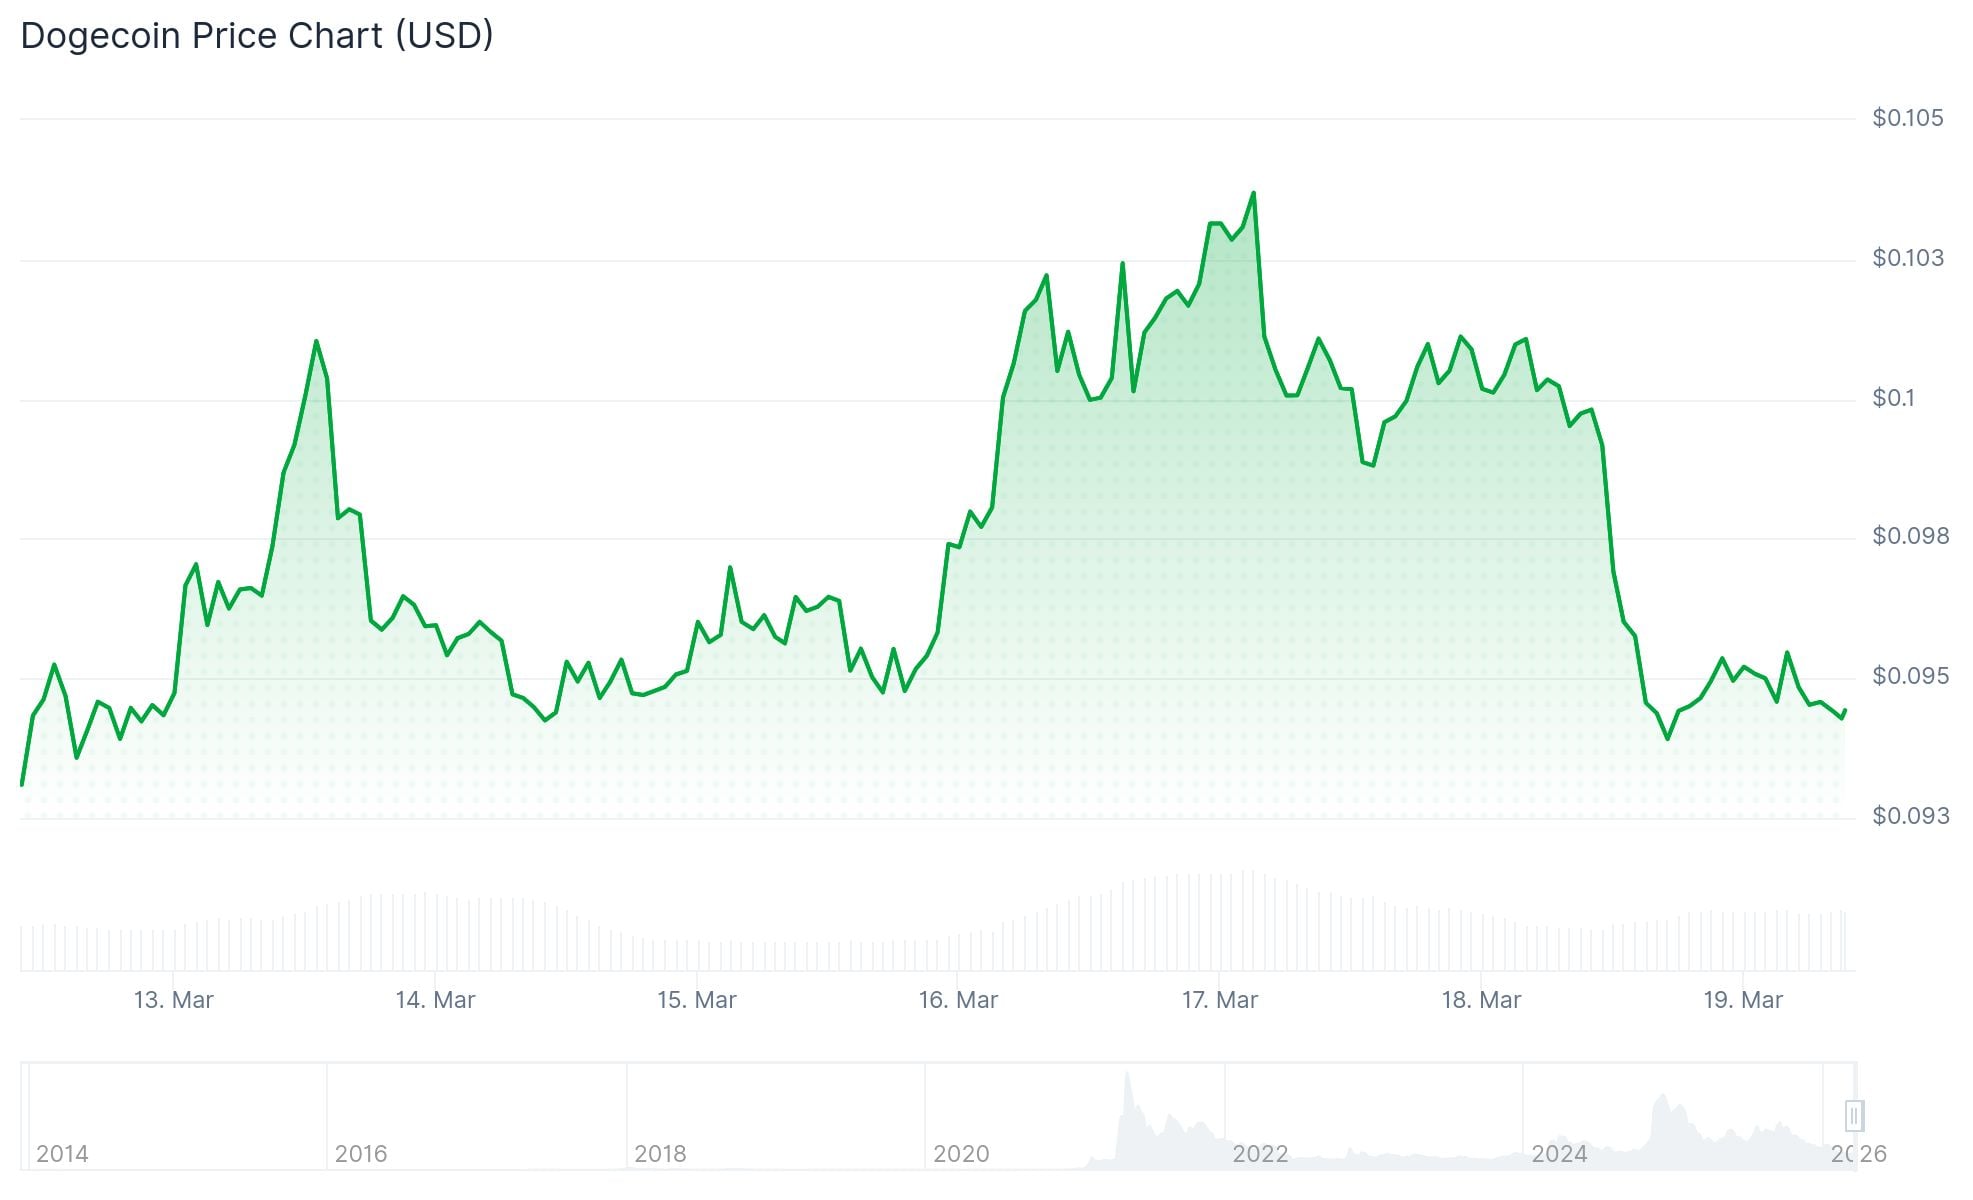
- DOGE was trading around $0.094 on March 18, down nearly 5% in 24 hours.
Dogecoin is moving sideways near the $0.10 level, compressing into a pattern that traders are watching closely. The setup has attracted attention because of what history says may come next—but the short-term picture is less clear.
 Dogecoin (DOGE) Price
On the daily chart, DOGE is forming what analysts call a falling wedge. This is a pattern where price makes lower highs but the lows are getting closer together. When the price range compresses enough, a breakout tends to follow. Traders who have held through the drop are hoping that breakout is upward.
The compression began after a correction phase that followed strong earlier gains. Since then, Dogecoin has been posting lower highs and lower selling pressure, suggesting that sellers may be losing steam.
Short-Term Resistance Is Holding
The first hurdle for any recovery is the $0.105 to $0.11 zone. This area lines up with the 0.5 to 0.618 Fibonacci retracement levels from the most recent price drop. It also overlaps with short-term exponential moving average clusters, making it a dense resistance zone.
DOGE has already tested the $0.10 level multiple times over the past year. Each time it crossed above, sellers came back and pushed it lower. Analysts say this pattern weakens $0.10 as a reliable support base.
A clear move above $0.11 would open the door to $0.116 and then $0.136. Until that happens, the price remains below the 50-, 100-, and 200-day moving averages, which keeps the overall trend bearish.
On March 18, DOGE was trading near $0.094, down 4.84% on the day.
The 50-Day EMA Is the Real Test
Even if DOGE clears $0.11, the 50-day EMA sits just above and has been tracking the downtrend since the correction started. This moving average adjusts as price moves, making a sustained breakout above it harder to hold.
Historically, reclaiming the 50 EMA has been the first credible sign that DOGE’s trend is shifting. Without that confirmation, analysts consider any rally above $0.10 a short-term bounce rather than a reversal.
The RSI has recovered from oversold levels and is sitting near the midline with a mild bullish lean. The MACD is also approaching a potential bullish crossover, suggesting that downside momentum is easing.
The most recent data shows DOGE still holding above its longer-term support base at $0.086, which was the latest local low before the current bounce.
The post Dogecoin (DOGE) Price: The Falling Wedge That Has Traders Paying Attention appeared first on CoinCentral.


You May Also Like

Gridmatic – AI-Powered Energy for Flexible Loads

Indian Rupee Slides as US-Iran Stalemate Pushes Oil Prices Higher


