Microsoft Stock Outlook: Bearish Trend With Growing Signs of Short-Term Exhaustion

Microsoft stock (MSFT) remains in a corrective phase with a bearish short-term bias, yet price action near $390 is starting to signal downside exhaustion rather than outright capitulation.
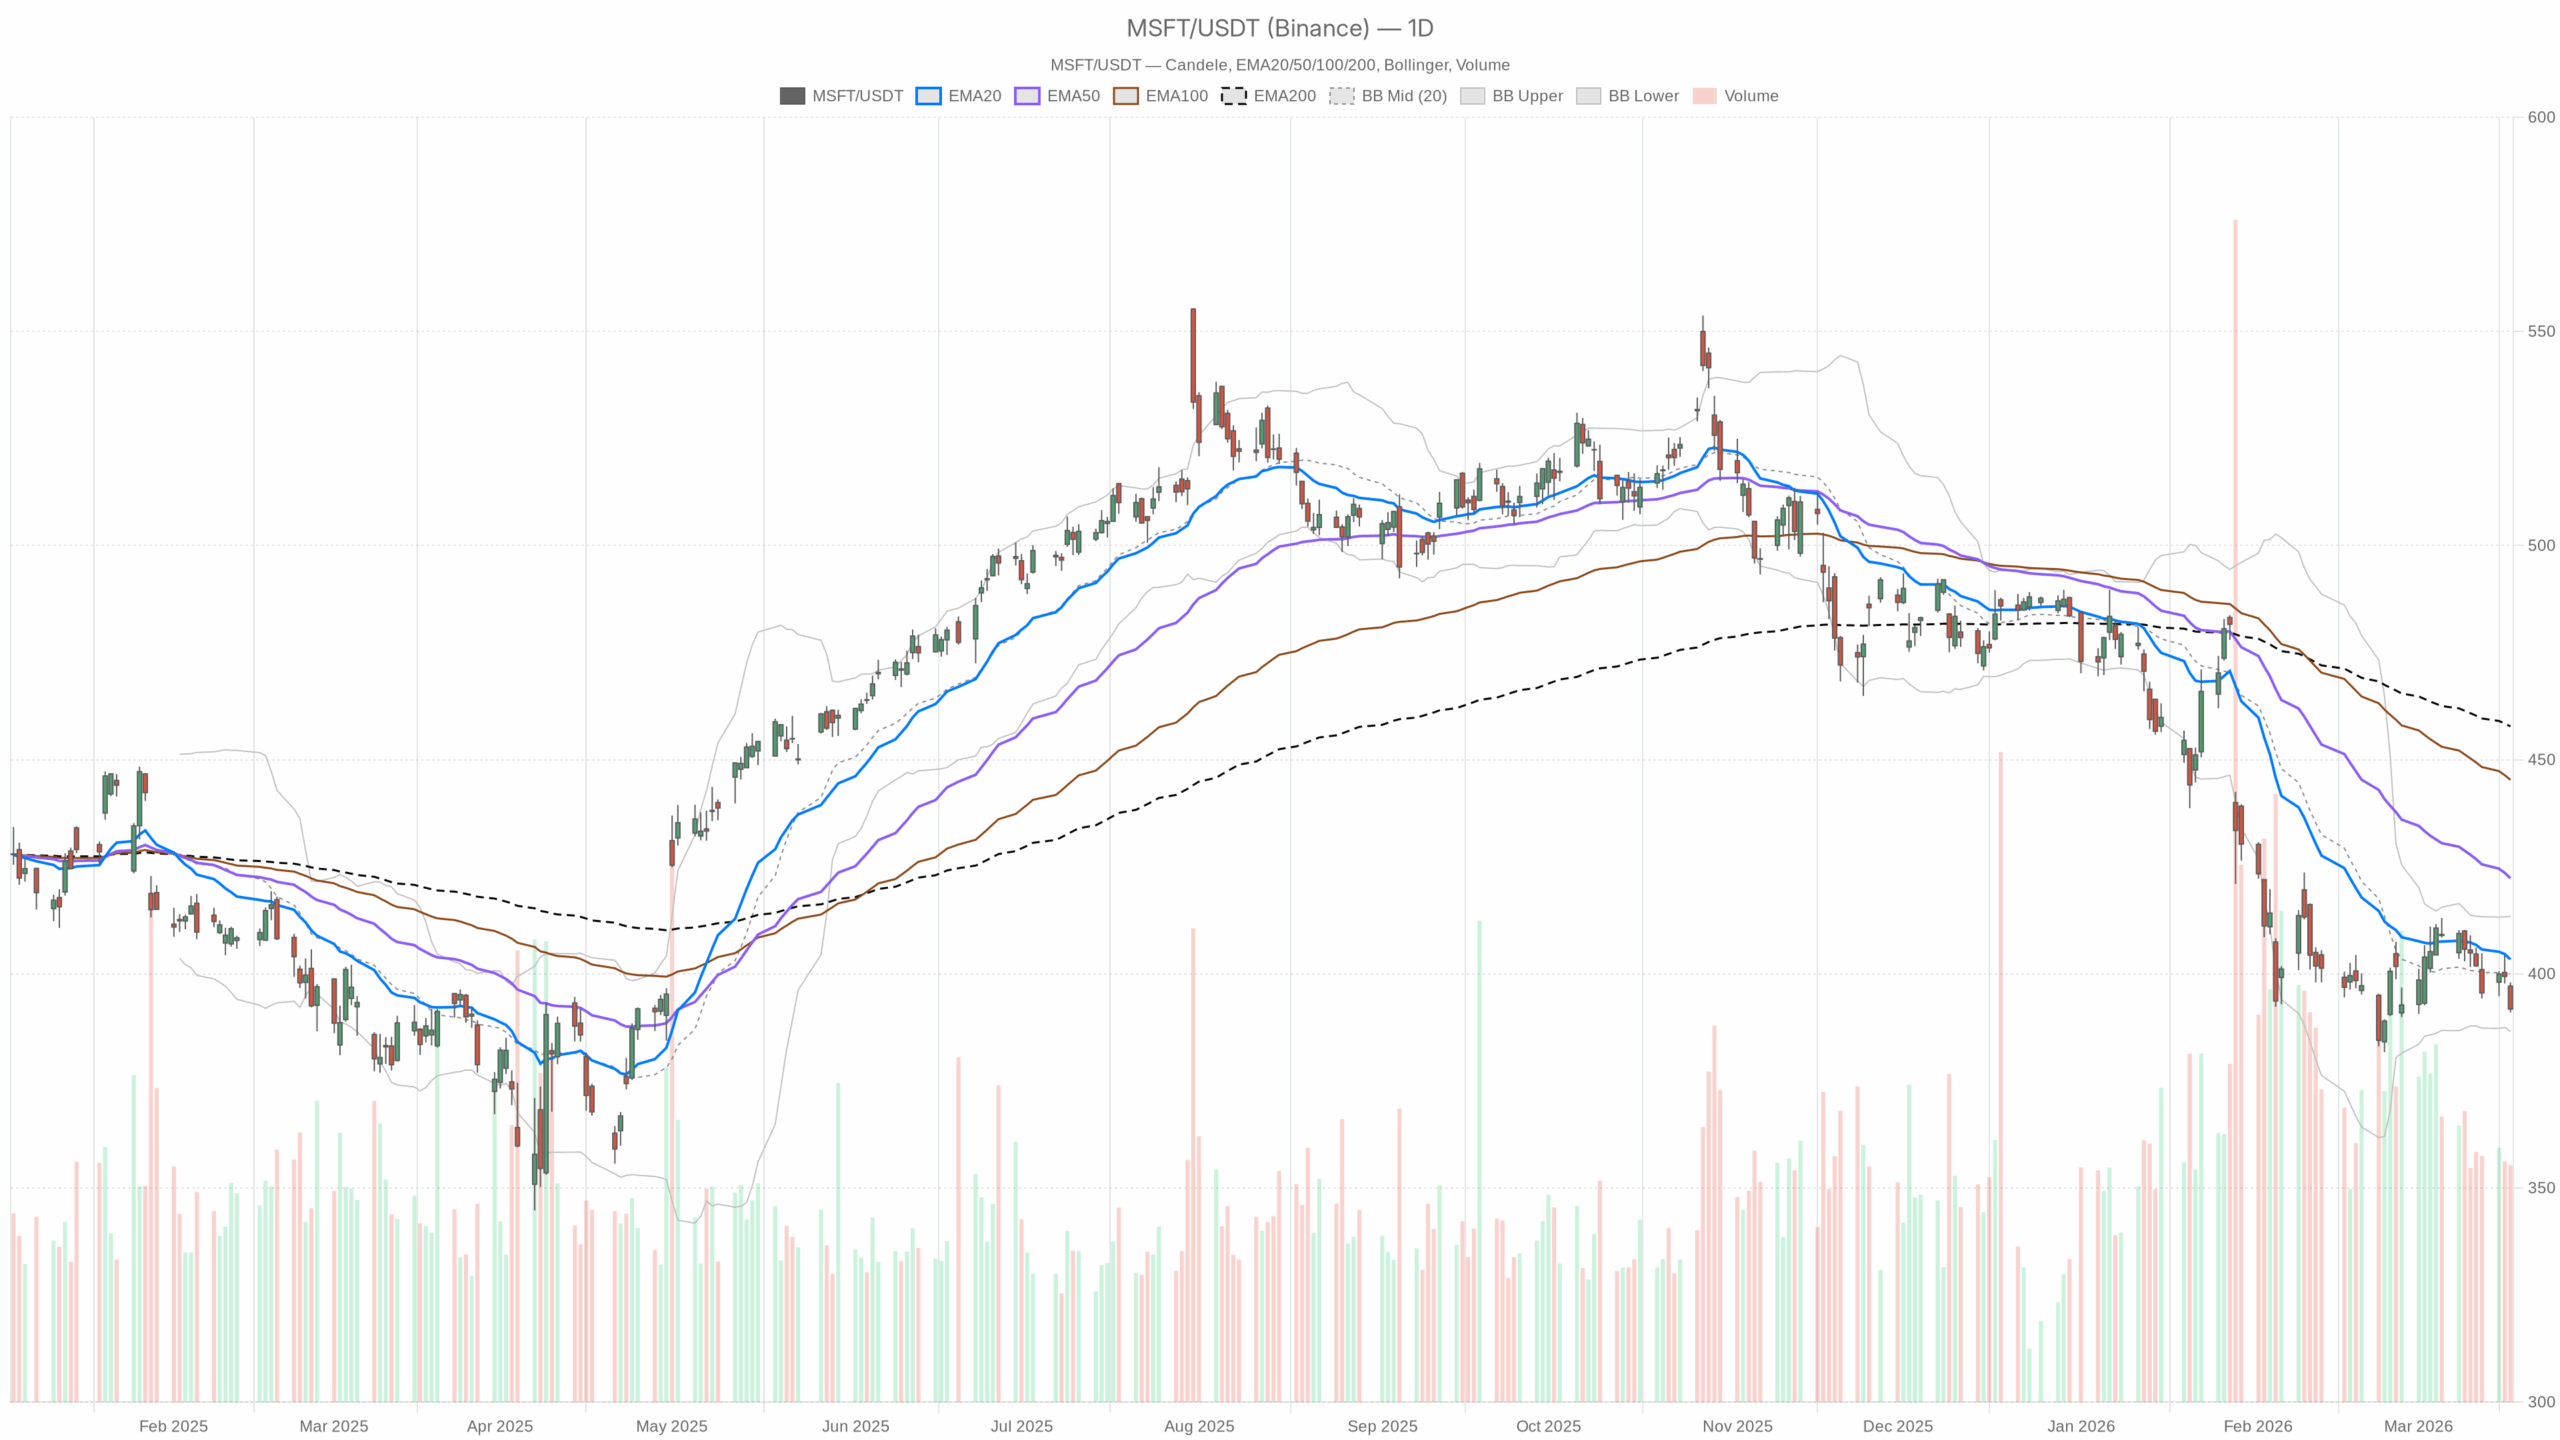 MSFT — daily chart with candlesticks, EMA20/EMA50 and volume.
Daily Chart: Microsoft Stock in a Controlled but Bearish Correction
On the daily chart, Microsoft stock closed at $391.79 on March 18, not far above the prior day’s low and well below its recent highs. Price now sits beneath the 20-day EMA at $403.39, the 50-day EMA at $422.33, and the 200-day EMA at $457.79. Interpretation: trading below all three EMAs confirms that the primary trend has turned down in the short to medium term. Rallies toward $400–$420 are currently rallies into resistance rather than trend continuation.
Furthermore, the daily regime flag is bearish, which aligns with the EMA structure and the 22%–30% pullback referenced in recent coverage. Interpretation: the market is treating the recent decline as more than a minor dip, even if the broader fundamental narrative around AI, Azure, and backlog remains constructive in the news flow.
However, the daily RSI at 37.54 is now approaching oversold territory without yet being extreme. Interpretation: momentum is clearly negative, but not washed out. Sellers are in control, yet the pace of decline is slowing as the stock nears levels where value-oriented buyers may start to re-engage.
The daily MACD line stands at -6.24 with a signal line at -7.31 and a positive histogram of 1.07. Interpretation: MACD remains in negative territory, confirming the broader downtrend. At the same time, the positive histogram shows that downside momentum is easing and a stabilization phase or countertrend bounce is possible if price can hold current support.
Daily Bollinger Bands reinforce that picture. The mid-band sits at $400.01, with the upper band near $413.45 and the lower band at $386.56, while MSFT closed just above the lower band. Interpretation: price hugging the lower band confirms ongoing selling pressure. However, the proximity to the band’s edge also signals that the stock is stretched on the downside in the short term and vulnerable to mean reversion if sellers lose conviction.
Volatility on the daily timeframe, as measured by ATR(14), stands at $8.30. Interpretation: this is an elevated but not extreme reading, pointing to wider but still orderly daily ranges, consistent with a controlled correction rather than panic.
Meanwhile, classical daily pivot levels place the central pivot at $393.60, with first resistance (R1) at $396.19 and first support (S1) at $389.19. MSFT’s latest close at $391.79 is just below the pivot and above S1. Interpretation: the stock is trading in the lower half of its intraday reference range, reflecting a bearish tilt, but it has not yet broken down through the first support level that would open the way to the lower Bollinger band around $386–$387.
Fundamental Narrative Versus Technical Pressure
On the news front, sentiment is split between long-term optimism and near-term caution. Recent analysis from Seeking Alpha labels the pullback in Microsoft stock a potential “generational buying opportunity,” citing heavy AI capex, Azure growth, a $625 billion backlog, and a $495 price target. Interpretation: long-horizon investors see the drawdown as fundamentally driven by valuation compression rather than a collapse in operating performance.
In contrast, another Seeking Alpha note has shifted Microsoft to Hold amid AI margin and churn risks, while Yahoo Finance highlights a roughly 30% year-to-date drop from record highs in 2026. Interpretation: some analysts are now more concerned about how AI economics filter into margins and customer behavior. As a result, the technical correction is being reinforced by a more sober reassessment of the risk-reward at prior valuations.
Overall, the daily timeframe sets a primary bearish bias, but one occurring within a still constructive long-term fundamental backdrop. For traders, the key is that the trend is down for now. For investors, the question is more about timing entry rather than the existence of a structural story.
Hourly Chart: Bearish Trend, But Short-Term Selling Looks Tired
The 1-hour chart broadly confirms the daily bearish view, yet it also shows that the immediate leg lower is becoming stretched. MSFT’s last hourly close at $391.67 sits firmly below the 20-hour EMA at $396.34, the 50-hour EMA at $399.22, and the 200-hour EMA at $407.34. Interpretation: the intraday trend is aligned to the downside with layered resistance now stacking overhead from roughly $396 to $407.
Notably, the 1H RSI is down at 31.38. Interpretation: this reading is close to oversold on the intraday timeframe, indicating that while bears remain dominant, incremental downside may become harder to achieve without at least a brief relief bounce.
The 1H MACD line at -2.13 is below its signal line at -1.62, with a negative histogram of -0.52. Interpretation: short-horizon momentum is still pointing lower, unlike the slightly improving MACD histogram on the daily chart. This divergence reveals a timing nuance: the broader downswing is losing steam, but the last intraday push to the downside has not yet fully exhausted itself.
Hourly Bollinger Bands show a mid-band at $397.14, with the upper band at $402.80 and the lower band very near current price at $391.48. Interpretation: MSFT is again leaning on the lower band, confirming persistent intraday selling pressure. Yet the proximity to the band points toward compression where even modest buying can snap the price back toward the mid-band around $397.
The 1H ATR(14) stands at $2.25. Interpretation: this intraday volatility is meaningful but controlled, implying that short-term traders should expect multi-dollar swings, though the moves remain within a well-defined down channel rather than disorderly spikes.
From a pivot perspective, the hourly central pivot is at $391.71, with R1 at $392.42 and S1 at $390.96. The latest hourly close at $391.67 is almost exactly on the pivot. Interpretation: intraday price is at a decision point. Sustained trade below $391.70 would favor a test of S1 and perhaps the daily S1 around $389, while holding and reclaiming R1 would be the first small sign of short-term stabilization.
Therefore, the 1H chart corroborates the daily bearish bias but tempers it with near-oversold conditions. Sellers remain in control, yet the room for an uninterrupted decline is shrinking, especially if macro or company-specific headlines turn marginally more constructive.
15-Minute Context: Leaning on Support, Watching for a Bounce or Breakdown
On the 15-minute chart, Microsoft stock is also in a bearish regime, but here the focus is primarily execution and timing rather than directional forecasting. The latest 15-minute bar shows a close at $391.67, after an intraday swing between $391 and $392.21. Interpretation: the very short-term tape is tight and indecisive, hovering just above the day’s low but not making new lows at the close of the bar.
The 15m EMAs reinforce the downward skew, with the 20-period EMA at $393.55, the 50-period EMA at $395.60, and the 200-period EMA at $399.85, all above price. Interpretation: any very short-term rally toward $393–$396 faces layered dynamic resistance, which intraday traders will likely treat as areas to fade unless the structure changes.
Short-horizon RSI on the 15m timeframe stands at 33.81. Interpretation: the market is leaning bearish but not yet deeply oversold at this micro level, which leaves room for another push lower during the session before buyers step in more forcefully.
The 15m MACD line is at -1.34 versus a signal line at -1.29, with a slightly negative histogram of -0.06. Interpretation: momentum is still marginally negative but flattening out, consistent with the idea of a market that is pausing and reassessing after a down move, rather than accelerating lower right now.
On the volatility side, the 15m ATR(14) is $1.05. Interpretation: very short-term traders can expect roughly $1 swings within a typical bar, underlining intraday choppiness around the current support area.
Meanwhile, 15-minute Bollinger Bands show a mid-band at $393.51, an upper band at $396.08 and a lower band at $390.94. Price is sitting between the pivot and the lower band, with the 15m pivot point at $391.63, R1 at $392.26 and S1 at $391.05. Interpretation: MSFT is consolidating around a local pivot just above short-term support. A break through $391.05 would open a test of the lower band and potentially align with a drive toward the daily S1 near $389, while holding this zone could fuel a brief rotation back toward $393–$394.
Bullish Scenario: Stabilization Above $389 and a Reversion Toward the $400 Handle
For a credible bullish case in Microsoft stock, the first requirement is stabilization on the daily timeframe. Practically, that means holding above the immediate support cluster formed by the daily S1 at $389.19 and the lower daily Bollinger band around $386.56. Interpretation: if buyers defend this $386–$390 corridor, it would confirm that the market is treating the recent 20%+ pullback as an opportunity rather than the start of a deeper structural unwind.
On momentum, a bullish scenario would need the daily RSI to turn back up from the high 30s and move toward neutral levels, while the daily MACD histogram continues to improve and heads toward a bullish cross. Interpretation: that would signal that the worst of the downside pressure has passed and that dip-buyers are beginning to absorb supply.
On the hourly chart, bulls would want to see price reclaim and hold above the 1H pivot at $391.71, then push through R1 at $392.42 and on toward the mid-Bollinger band and 20-hour EMA near $396–$397. Interpretation: such a move would break the immediate sequence of lower highs and lower lows. It would also reframe intraday dips as potential buying opportunities rather than continuation short setups.
On a 15-minute basis, a constructive sign for the bullish camp would be a series of higher lows off the $391–$391.05 area, accompanied by RSI lifting back toward the mid-40s or 50s and MACD flipping modestly positive. Interpretation: this would show that liquidity is building on the bid at current prices and that short-covering is reinforcing the fundamental dip-buying interest highlighted in recent bullish research.
Structurally, any sustained daily close back above the 20-day EMA at $403.39 would be a key milestone for the bullish narrative in Microsoft stock. Interpretation: it would indicate that the current leg lower has likely ended, that volatility is being absorbed, and that the stock can start to work its way back into the prior consolidation zone between roughly $400 and $430, even if it remains below the 50-day and 200-day EMAs for some time.
Bearish Scenario: Breakdown Through $389 and a Trend Extension Lower
On the other hand, the bearish scenario focuses on the risk that a fragile support zone fails under the weight of continued selling and more cautious analyst commentary. A clean break and daily close below the daily S1 at $389.19, followed by pressure toward the lower Bollinger band near $386.56, would signal that bears remain firmly in charge. Interpretation: in that case, the corrective phase would be extending, with the market perhaps reassessing the appropriate multiple for Microsoft’s AI and cloud businesses after a period of exuberance.
On the daily chart, a further drop in RSI toward or below 30, combined with MACD remaining deeply negative without further histogram improvement, would back this bearish view. Interpretation: such a pattern would indicate renewed downside acceleration instead of the gradual loss of momentum we see today.
Intraday, the hourly chart would support a bearish extension if MSFT starts to consistently trade below the 1H pivot at $391.71 and the first support at $390.96, while the 20-hour EMA at $396.34 continues to cap any rallies. Interpretation: that would confirm that every bounce is being sold and that short-term participants are leaning into the downtrend.
On the 15-minute timeframe, repeated failures at the 20-EMA around $393.55, combined with breaks below S1 at $391.05 and closer interaction with the lower band at $390.94, would corroborate the move. Interpretation: this would show that even micro bounces are being faded, keeping pressure on the daily support levels.
Crucially, for the bearish case to truly invalidate the emerging bullish arguments around Microsoft stock, the price would likely need to stay pinned below the daily 20-EMA for a sustained period and begin carving out a sequence of lower lows on the daily chart. Interpretation: in that environment, the narrative of a “generational buying opportunity” would give way, at least tactically, to concerns about a more protracted de-rating in big-cap tech and AI leaders.
Positioning, Volatility and Key Microsoft Stock Levels to Watch
In summary, the dominant message from Microsoft’s charts is a bearish short- to medium-term trend with early signs of downside exhaustion near the $390 area. The daily and hourly timeframes both point lower, though the intraday RSI readings and MACD nuances indicate that fresh shorts are less attractive here than they were earlier in the decline.
At the same time, volatility is elevated but orderly. Daily ATR around $8.30 and hourly ATR near $2.25 mean that price can move several dollars in either direction within a typical session. Interpretation: position sizing and entry timing matter more than usual, especially for those trying to finesse entries within the current support band.
Key levels to monitor in the near term include $389–$386 on the downside, which frame the immediate daily support zone, and $396–$403 on the upside, where the hourly 20-EMA and the daily 20-EMA converge with Bollinger mid-bands and prior intraday congestion. Interpretation: a break below the lower band of support would confirm trend extension, while a sustained recovery above the $400 handle would signal that Microsoft stock is beginning to transition from a corrective phase back toward consolidation.
Until one of those zones breaks decisively, the base case remains a cautious bearish bias with a growing risk of a tactical rebound, underpinned by still-solid fundamentals but tempered by valuation and AI-margin debates playing out in the background.


You May Also Like

Trump biographer: Epstein joked about his legal troubles while orchestrating defense

BNB slips below $590 as Trump threatens to strike Iranian power plants