The Gold (XAU) price just had one of its roughest weeks in decades, and the selloff has caught a lot of traders off guard. According to market commentary, you’dThe Gold (XAU) price just had one of its roughest weeks in decades, and the selloff has caught a lot of traders off guard. According to market commentary, you’d

Gold Price Just Logged Its Worst Week Since 1982 – Could a 50% Rebound Be Happen?

2026/03/22 20:00
4 min read
For feedback or concerns regarding this content, please contact us at crypto.news@mexc.com

The Gold (XAU) price just had one of its roughest weeks in decades, and the selloff has caught a lot of traders off guard. According to market commentary, you’d have to go all the way back to 1982 to find a worse weekly drop.

But interestingly, that same period also tells a different story. The last time the gold price saw a decline this sharp, it went on to rally nearly 50% within the following year. That’s why some traders are starting to see this drop not as the end, but as a potential setup.

What the Gold Chart Is Showing Right Now

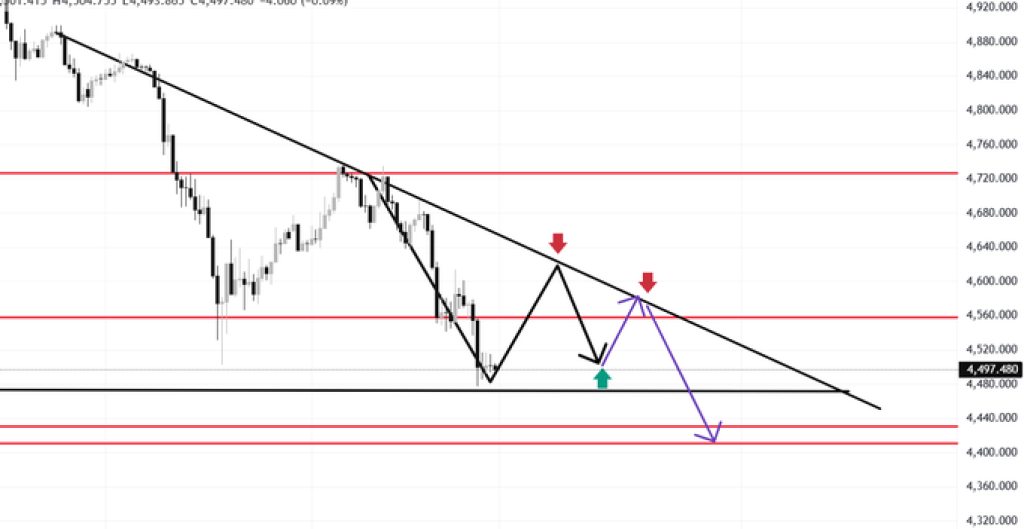
On the short-term chart, we can see that gold is in a downtrend. It is respecting the descending trendline.

The gold price is trading around the support area of 4,440 to 4,480. This is the same support area as the previous base.

We can also notice a pattern here. The price bounced from the support, went up to the resistance around the trendline, then was rejected again. That rejection suggests sellers are still in control for now.

If the gold price heads back up toward the 4,550–4,570 zone, expect some pushback. That area isn’t just a number, it’s where the trendline meets a past support that flipped to resistance. Chances are, sellers are waiting there to make their move.

Source: X/Shirley

Gold Price Short-Term Outlook: More Downside First?

As things stand, the short-term bias is still slightly bearish. However, if the Gold price is unable to hold above the 4,460-4,450 range, then the price can continue to fall towards 4,420 and potentially even revisit the 4,400 mark.

On the flip side, if the price does manage to rise towards the 4,550-4,570 range without a good breakout, then the price can simply be making a lower high, which usually leads to another fall.

In essence, the gold price appears to be having some further downside potential before it stabilizes at a certain value.

Why Are Some Traders Still Bullish?

While the short-term chart looks weak, the bigger picture tells a more balanced story.

The long-term chart shows that the gold price came off a major rally before this pullback. Even after the drop, price is still holding above key higher-timeframe support zones.

However, macro factors haven’t really changed. Rising government debt, ongoing currency devaluation concerns, and strong demand for precious metals, especially silver, are still in play.

There’s also growing talk about supply pressure in silver markets, with industrial demand outpacing supply. Historically, that kind of imbalance tends to support higher prices across the precious metals space over time.

Read Also: Crypto Expert Gives 3 Reasons Cardano (ADA) Price Could Rally Soon

Could a 50% Rebound Actually Happen?

Yes, it is definitely possible, but as the old saying goes, “timing is everything.”The gold price is still in a short-term downtrend, and the chart is suggesting that there is possibly further downside or consolidation to come before any big upwards move is made. 

However, if history is set to repeat itself even half as well as the last few years, then this kind of sell-off may turn out to be a buying opportunity in the long term.

What to look out for is how the gold price reacts to the $4,400 mark. If the price can hold around here and create a good base, then possibly the long-awaited recovery is about to begin.

As things stand, the market is looking quite weak in the short term but still has tremendous potential in the long term.

Subscribe to our YouTube channel for daily crypto updates, market insights, and expert analysis.

The post Gold Price Just Logged Its Worst Week Since 1982 – Could a 50% Rebound Be Happen? appeared first on CaptainAltcoin.

Market Opportunity
League of Traders Logo
League of Traders Price(LOT)
$0.007402
$0.007402$0.007402
-1.60%
USD
League of Traders (LOT) Live Price Chart
Disclaimer: The articles reposted on this site are sourced from public platforms and are provided for informational purposes only. They do not necessarily reflect the views of MEXC. All rights remain with the original authors. If you believe any content infringes on third-party rights, please contact crypto.news@mexc.com for removal. MEXC makes no guarantees regarding the accuracy, completeness, or timeliness of the content and is not responsible for any actions taken based on the information provided. The content does not constitute financial, legal, or other professional advice, nor should it be considered a recommendation or endorsement by MEXC.

You May Also Like

Markets await Fed’s first 2025 cut, experts bet “this bull market is not even close to over”

Markets await Fed’s first 2025 cut, experts bet “this bull market is not even close to over”

Will the Fed’s first rate cut of 2025 fuel another leg higher for Bitcoin and equities, or does September’s history point to caution? First rate cut of 2025 set against a fragile backdrop The Federal Reserve is widely expected to…
Share
Crypto.news2025/09/18 00:27
CEO Sandeep Nailwal Shared Highlights About RWA on Polygon

CEO Sandeep Nailwal Shared Highlights About RWA on Polygon

The post CEO Sandeep Nailwal Shared Highlights About RWA on Polygon appeared on BitcoinEthereumNews.com. Polygon CEO Sandeep Nailwal highlighted Polygon’s lead in global bonds, Spiko US T-Bill, and Spiko Euro T-Bill. Polygon published an X post to share that its roadmap to GigaGas was still scaling. Sentiments around POL price were last seen to be bearish. Polygon CEO Sandeep Nailwal shared key pointers from the Dune and RWA.xyz report. These pertain to highlights about RWA on Polygon. Simultaneously, Polygon underlined its roadmap towards GigaGas. Sentiments around POL price were last seen fumbling under bearish emotions. Polygon CEO Sandeep Nailwal on Polygon RWA CEO Sandeep Nailwal highlighted three key points from the Dune and RWA.xyz report. The Chief Executive of Polygon maintained that Polygon PoS was hosting RWA TVL worth $1.13 billion across 269 assets plus 2,900 holders. Nailwal confirmed from the report that RWA was happening on Polygon. The Dune and https://t.co/W6WSFlHoQF report on RWA is out and it shows that RWA is happening on Polygon. Here are a few highlights: – Leading in Global Bonds: Polygon holds 62% share of tokenized global bonds (driven by Spiko’s euro MMF and Cashlink euro issues) – Spiko U.S.… — Sandeep | CEO, Polygon Foundation (※,※) (@sandeepnailwal) September 17, 2025 The X post published by Polygon CEO Sandeep Nailwal underlined that the ecosystem was leading in global bonds by holding a 62% share of tokenized global bonds. He further highlighted that Polygon was leading with Spiko US T-Bill at approximately 29% share of TVL along with Ethereum, adding that the ecosystem had more than 50% share in the number of holders. Finally, Sandeep highlighted from the report that there was a strong adoption for Spiko Euro T-Bill with 38% share of TVL. He added that 68% of returns were on Polygon across all the chains. Polygon Roadmap to GigaGas In a different update from Polygon, the community…
Share
BitcoinEthereumNews2025/09/18 01:10
Will XRP Price Increase In September 2025?

Will XRP Price Increase In September 2025?

Ripple XRP is a cryptocurrency that primarily focuses on building a decentralised payments network to facilitate low-cost and cross-border transactions. It’s a native digital currency of the Ripple network, which works as a blockchain called the XRP Ledger (XRPL). It utilised a shared, distributed ledger to track account balances and transactions. What Do XRP Charts Reveal? […]
Share
Tronweekly2025/09/18 00:00