

Ethereum Rejects $2300 Zone as Downtrend Structure Remains Intact
- ETH rejected $2,300 after a liquidity sweep, with price now near $2,148 and sellers maintaining control.
- Ethereum is down 26.56% in 90 days, while 7-day losses stand at 6.70% despite a 30-day gain of 10.47%.
- Binance long/short ratio at 1.5981 shows crowded longs as ETH trades below key resistance levels.
Ethereum is trading near $2,148 after failing to hold above the $2,300 level. The rejection confirms selling pressure remains active. While short-term data shows mild stability, the broader trend continues to lean bearish.
Rejection at $2,300 Signals Weak Momentum
Ethereum briefly moved above the $2,300 zone but failed to sustain the move. The breakout turned into a liquidity sweep, where stops were triggered before price reversed. This type of move often signals weak buying strength.
The $2,230 to $2,400 range now acts as a supply zone. Sellers entered quickly and pushed the price back down. Buyers were unable to maintain control, which kept the market under pressure.
Short-term data supports this view. The 4-hour change is +0.02%, while the 24-hour gain is +0.73%. These small moves show consolidation, not strong momentum.
Multi-Timeframe Trend Shows Mixed Signals
Short-term performance shows slight stability, but the mid-term trend is mixed. Over the past seven days, Ethereum is down 6.70%. At the same time, the 30-day performance shows a gain of 10.47%.
This pattern suggests a pullback after a recent rise. The market likely moved higher, then entered a correction phase. Price is now in a transition range without clear direction.
Longer-term data confirms weakness. Ethereum is down 26.56% over 90 days and 44.09% over 180 days. Year-to-date, price is also down 27.09%, which keeps the broader structure bearish.
Key Zones and Structure Define Market Direction
Ethereum continues to show a bearish structure on the daily chart. Multiple breaks of structure confirm that sellers remain in control. The trend has stayed intact since the peak near $4,957.
A fair value gap sits between $2,474 and $2,634. This zone may attract price if buyers regain strength. Above that, the $2,898 to $3,034 range acts as a strong resistance area.
On the downside, $1,840 remains a key support level. If price breaks below this level, the next area to watch is near $1,300. A descending trendline also continues to limit upward movement.
Sentiment Data Points to Crowded Long Positions
Market positioning shows that many traders are still long. Binance data shows a long-to-short ratio of 1.5981, while OKX shows 1.43. This indicates a strong preference for long positions.
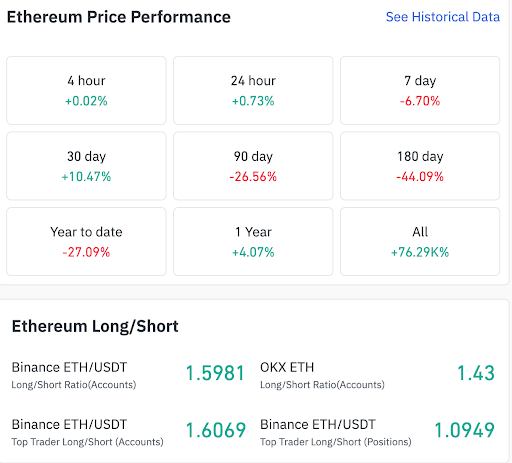 Ethereum mixed performance as long positions rise, source: Coinglass data.
Top trader data shows a similar pattern. The long-to-short ratio by accounts is 1.6069, while positions stand at 1.0949. This means even experienced traders lean toward the upside.
Despite this, the broader trend remains weak. The one-year return is only 4.07%, showing limited recovery. However, long-term data shows a gain of 76.29K%, reflecting strong historical growth.
The post Ethereum Rejects $2300 Zone as Downtrend Structure Remains Intact appeared first on Live Bitcoin News.


You May Also Like

Gridmatic – AI-Powered Energy for Flexible Loads

Indian Rupee Slides as US-Iran Stalemate Pushes Oil Prices Higher


