

What is Parabolic SAR?
1. Core Principles of the Parabolic SAR Indicator
Trend Identification:
- SAR dots below the price indicate an uptrend, suggesting a favorable environment for long positions.
- SAR dots above the price signal a downtrend, indicating a potential opportunity for short positions.
Stop-Loss and Reversal Signals:
- When SAR dots move closer to the price or are breached, it may suggest an impending trend reversal, prompting traders to reassess and adjust their positions accordingly.
2. Advantages of the Parabolic SAR Indicator
3. Limitations of the Parabolic SAR Indicator
4. How to Use the Parabolic SAR Indicator on MEXC
Popular Articles
View More
U.S. Stocks Weekly Report | Jul 24–30: MSFT Azure Surges 43% vs Meta’s 14% Profit Shrinkage—Mag7 Earnings Wrap Up, AI Winners Emerge?
In July 2026, the full-season earnings reports for the US stock market's Mag7 concluded with a major test of "AI monetization capabilities." Same theme (AI), same group of institutional investors,

Apple (AAPL) Price Target and Stock Price Prediction: Can the Stock Hit $400 When Apple Can't Build Enough?
Key Takeaways Wall Street's consensus Apple price target is $321.66, with individual analyst calls running from $215 to $400. AAPL fell about 6% in extended trading on July 30, 2026, despite Apple

Meme Coin Perpetual Futures: Which Exchange Actually Lists the Meme Perps You Want to Trade?
Which exchange is best for meme coin perpetual futures? MEXC lists 1,043 perpetual contracts, the widest menu on CoinGecko's tracker, and added 879 new perps between January 2025 and April 2026, at a

Hot Crypto Updates
View More
What Is GRVT? A Hybrid Exchange Powered by the ZK Stack
Traditional Perp DEXs often face several limitations, including low liquidity, slower execution speeds, and a trading experience that struggles to handle large orders efficiently. GRVT was developed

Amazon Q2 2026 Earnings Results: AWS Growth Hits 37% and AMZN Stock Jumps Despite $220 Billion CapEx Plan
When Were the Amazon Q2 2026 Earnings Released? Amazon announced its second-quarter 2026 financial results after the U.S. market closed on Thursday, July 30, 2026. The results covered the three

Microsoft FY2026 Q4 Earnings Beat Estimates as Azure Growth Accelerates and MSFT Stock Jumps
When Were the Microsoft Q4 FY2026 Earnings Released? Microsoft announced its fiscal fourth-quarter 2026 earnings after the U.S. market closed on Wednesday, July 29, 2026. The quarter covered the

Trending News
View More
Tesla Q1 2026 Earnings Review: Deliveries Rebounded, But Margin Quality Remains the Real Test
Tesla reported its Q1 2026 financial results on April 22, 2026, after the U.S. market close. The company delivered 358,023 vehicles in the quarter, generated total revenue of $22.4 billion, and report
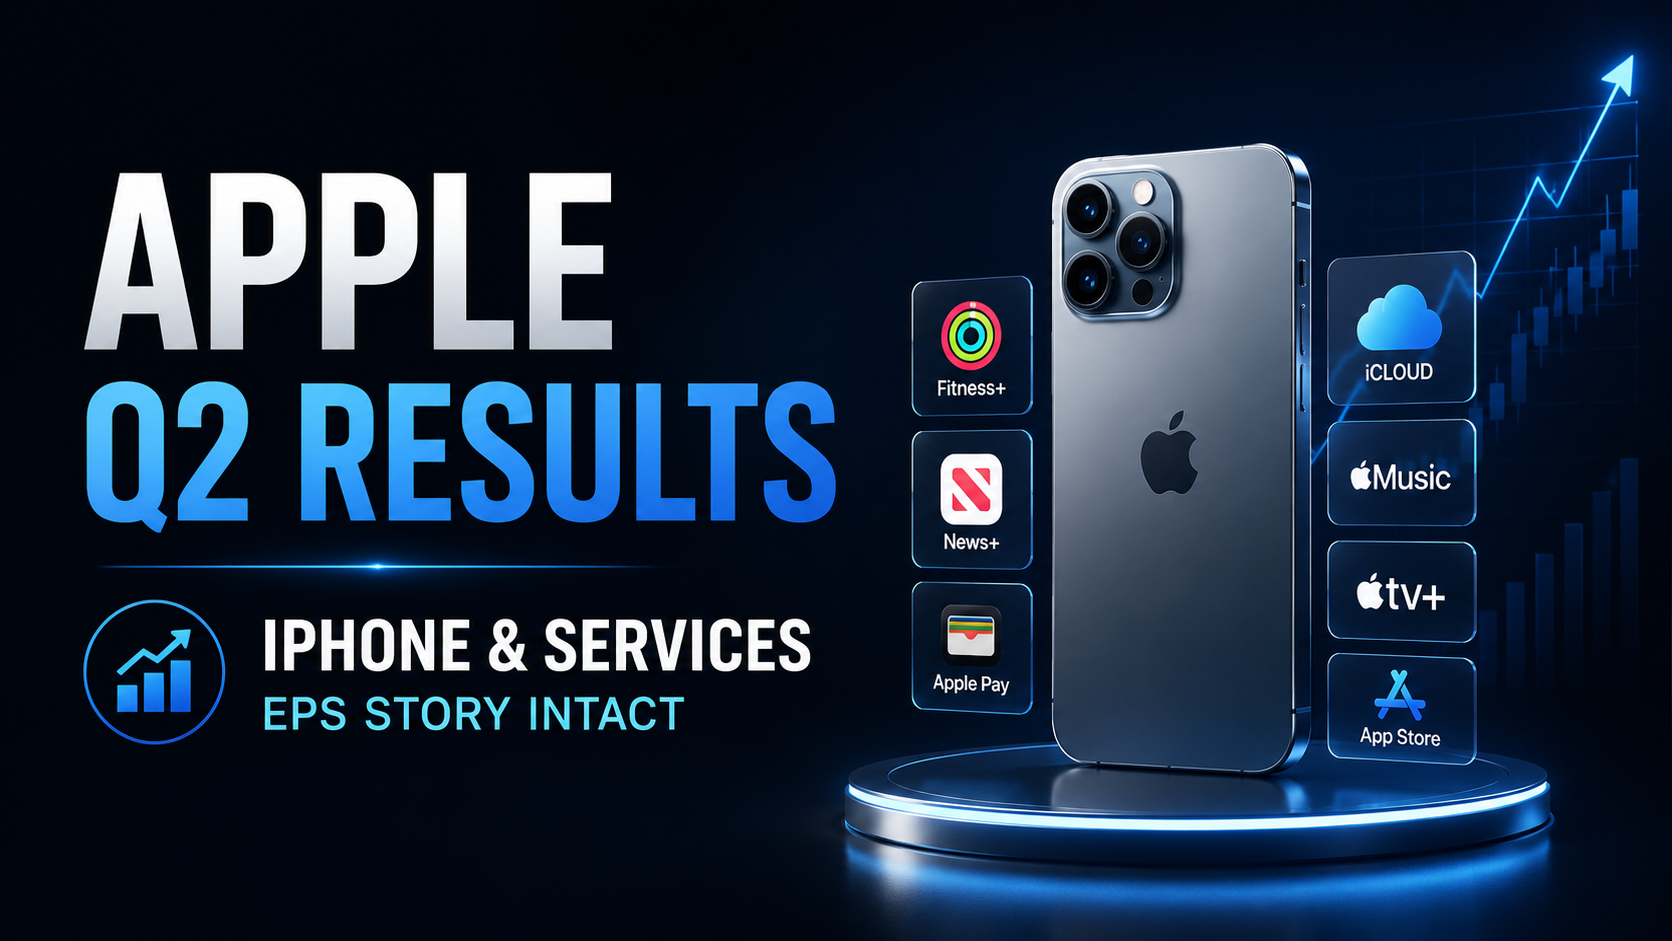
Apple FY2026 Q2 Earnings Review: iPhone Revenue and Services Growth Keep EPS Story Intact
Apple reported fiscal 2026 second-quarter results on April 30, 2026, covering the quarter that ended March 28, 2026. Revenue reached $111.2 billion, up 17% year over year, while diluted EPS rose 22% t

Hyperliquid Open Interest Hits $11.5 Billion: Are On-Chain Perpetuals Expanding into U.S. Equity Markets?
Hyperliquid’s open interest has reached approximately $11.5 billion, a new high for 2026, with HIP-3 markets contributing nearly $4 billion. The S&P 500-linked contract has become the largest HIP-3 ma

Related Articles
View More
Analysis of Common Technical Indicators in the Cryptocurrency Market
In crypto trading, technical indicator analysis refers to a quantitative method that uses mathematical and statistical formulas to assess market trends. By processing price and volume data through spe

How to Use TradingView on MEXC
TradingView is a powerful trading analysis tool that caters to users of all experience levels. MEXC has integrated TradingView's charting tools, allowing you to use them directly on the MEXC platform.

What Is the Stochastic Indicator (KDJ)?
The Stochastic Indicator (KDJ) is a technical analysis tool that analyzes price trends to assess market strength and identify overbought and oversold conditions, helping traders make buy and sell deci


