Alphabet Stock holds above $400 as overbought signals warn of a pause

Alphabet Stock extends its climb with the primary uptrend intact above $400, yet daily overbought signals argue for measured follow‑through and acceptance over nearby resistance rather than another vertical burst.
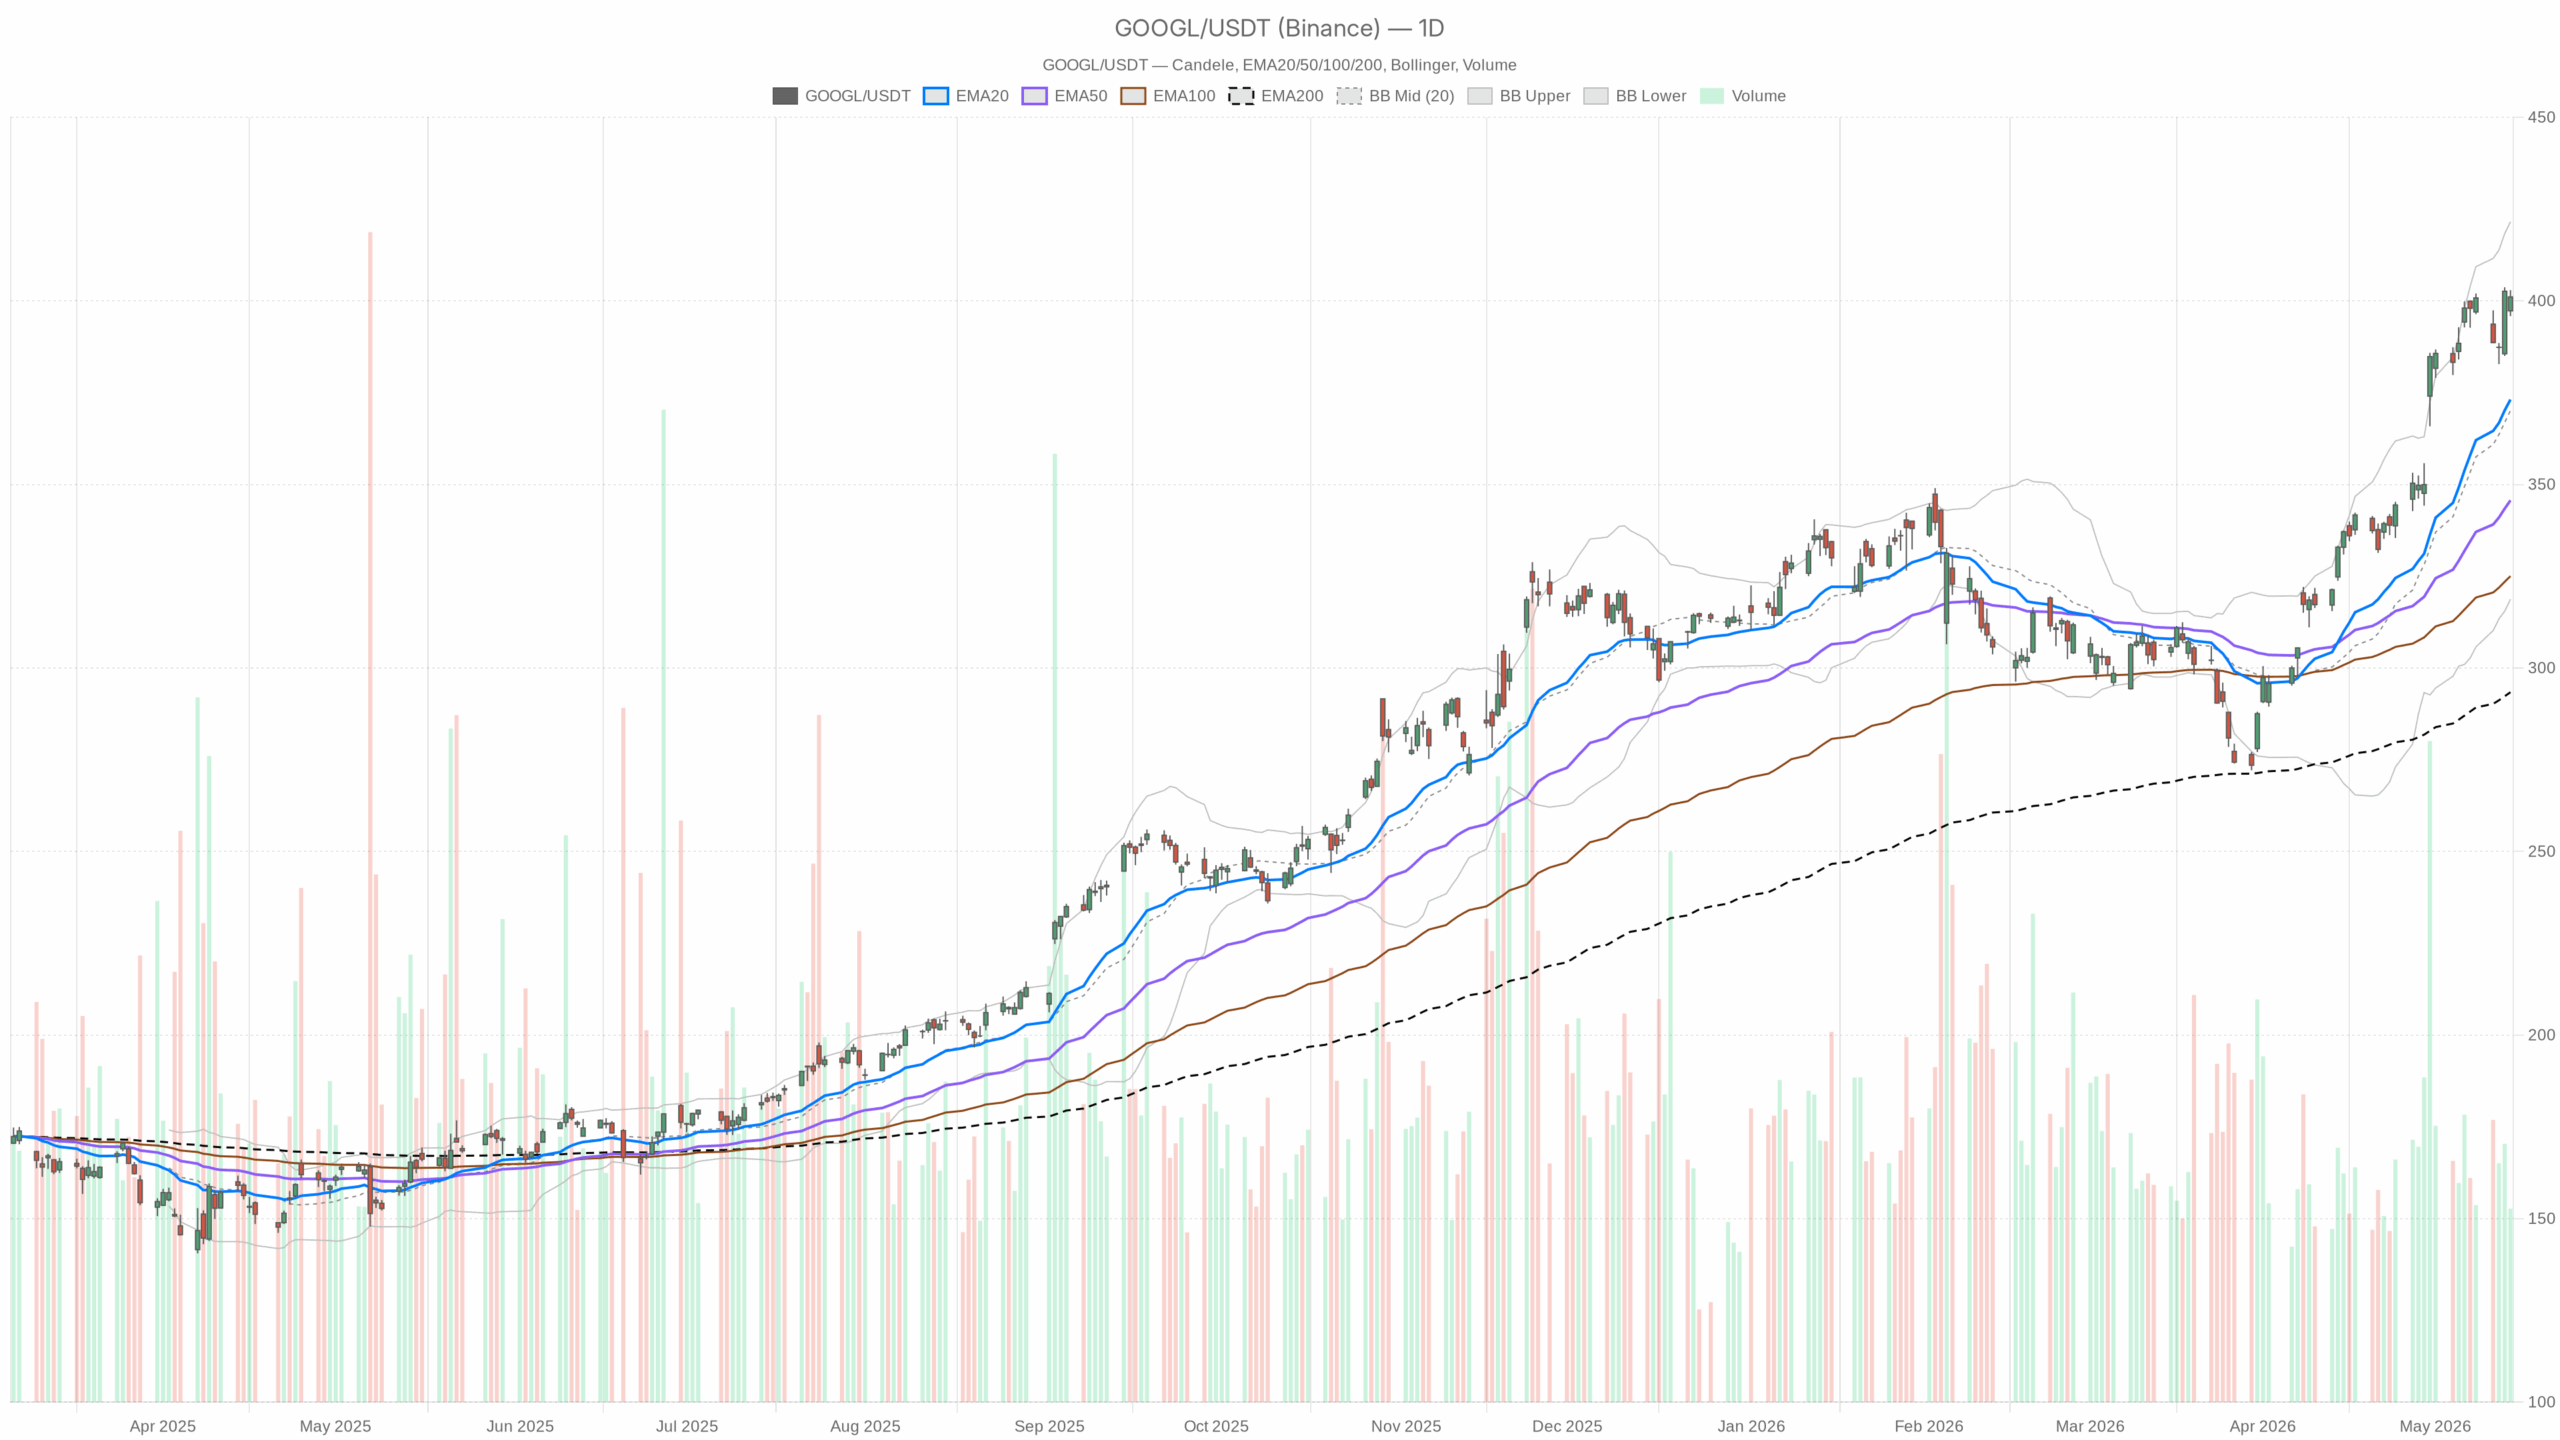 GOOGL — daily chart with candlesticks, EMA20/EMA50 and volume.
Alphabet Stock Technical Overview: Daily Uptrend Above $400
Price Action and Trend
On the daily timeframe, GOOGL closed at 401.07 after trading between 395.84 and 402.93. Buyers defended dips and kept control into the close. Daily EMAs sit at EMA20 373.12, EMA50 345.67, and EMA200 293.39, all well below price. Therefore, the longer‑term uptrend remains strong and broadly supported by rising averages.
Momentum and Volatility
Daily RSI14 prints 74.16. Momentum is firm but near overbought, which raises the risk of a pause or a shallow pullback. Daily MACD shows line 20.81 versus signal 19.64 with a histogram of 1.17. Upside momentum is positive, though incremental rather than explosive.
Bollinger Bands center at 370.14 with an upper band at 421.56 and a lower band at 318.71. Price sits in the upper half, so the trend has room before extreme band pressure, yet the tape is extended relative to its mean. Daily ATR14 is 11.26, implying level‑to‑level moves of roughly $10–$12.
Daily pivot levels place the pivot at 399.95, R1 at 404.05, and S1 at 396.96. Therefore, $400 is the battleground, with 404 as the near‑term cap and 397 as first meaningful support.
Intraday Structure: 1H Trend Supports Advance
Meanwhile on the 1H timeframe, GOOGL last printed 401.12 with a bullish regime confirmed by rising intraday EMAs: EMA20 397.74, EMA50 392.87, and EMA200 361.29. Pullbacks into the upper 390s continue to attract buyers.
1H RSI14 sits at 59.74, which is constructive without being stretched. 1H MACD shows line 2.29 over signal 1.97 with a histogram of 0.32, suggesting incremental follow‑through. The Bollinger mid‑line is 395.89 with bands at 409.17 and 382.61. Therefore, the path of least resistance remains higher unless the mid‑band near 396 is lost. 1H ATR14 is 3.52, supporting orderly trend progression.
1H pivot levels show PP at 400.78, R1 at 401.60, and S1 at 400.31. As a result, micro structure favors buy‑the‑dip behavior above 400, with a push through 401.60 needed for momentum extension.
15m Execution Layer: Coiling Below Resistance
At the 15m layer, price closed 401.12 with EMAs aligned higher: EMA20 400.37, EMA50 398.65, and EMA200 392.13. The micro trend remains up, offering a constructive backdrop for entries on shallow dips.
15m RSI14 is 55.83. MACD line 0.56 sits just below its signal at 0.60 with a small negative histogram of ‑0.04, which is consistent with brief consolidation rather than reversal. The Bollinger mid is 400.29 with bands at 402.70 and 397.88. 15m ATR14 is 1.33, keeping micro swings tight enough for defined risk around intraday pivot levels.
15m pivot levels list PP at 400.75, R1 at 401.54, and S1 at 400.33. Notably, a firm move through 401.54 would re‑energize buyers, while losing 400.33 risks a deeper test into 399–398.
News Flow and Valuation Context for Alphabet Stock
- Yahoo Finance highlighted Alphabet’s AI Cloud momentum, with Anthropic committing $200 billion to Google infrastructure. Interpretation: strategically positive for long‑run demand and cloud utilization.
- Motley Fool flagged that soaring AI spending could undercut a key market tailwind. Interpretation: capex intensity may weigh on margins or the multiple if revenue payback lags.
- Seeking Alpha noted strong Q1 growth but a valuation‑driven Hold stance. Interpretation: execution is solid, but expectations are high and leave less room for error.
- Another Yahoo Finance piece framed Alphabet as a contender to overtake Nvidia in market value on the AI boom. Interpretation: enthusiasm is elevated, reinforcing why the chart looks extended.
Scenarios and Bottom Line for Alphabet Stock
Bullish Case
Sustained holds above the daily pivot near 399.95 and the 1H pivot at 400.78 keep buyers in control. A clean push through 1H/15m R1 near 401.60 and daily R1 at 404.05 would open room toward the daily upper band region near 421.56 over time. ATR suggests intermediate steps rather than a straight line. Confirmation would include 1H RSI grinding above 60–65 and a widening positive MACD histogram. Acceptance above 404 signals renewed trend strength with measured upside.
Bearish Risk
On the other hand, failure to hold the 400 shelf that cascades through daily S1 at 396.96 and the 1H mid‑band near 395.89 would shift focus to the 392 area (15m EMA200). In a larger swing, the daily mean near the EMA20 373.12 comes into view. Invalidation of the bullish case would show up as 1H RSI slipping toward 50 with MACD crossing negative and price closing below 396. Losing the 397–396 zone turns the uptrend from cruise to corrective.
Overall, positioning into Alphabet Stock remains pro‑trend but should respect the overbought daily reading and nearby resistance at 404. Volatility is elevated but orderly, so range management matters. Watch the 401–404 band for confirmation and 400–397 for stress; the reaction there will likely set the next swing.


You May Also Like

Best Music AI Websites For Songs And Soundtracks

Binance Research: Illicit Crypto Still Under 1% of On-Chain Volume, But $75B in Flagged Funds Tests Tracing