

Bitcoin price today at $65,654: real rebound or bull trap?

On June 15, 2026, the Bitcoin price today stands at $65,654, in one of the most delicate areas of recent months: above the daily pivot point, but with a still dominant bearish daily structure. The short-term rebound is not enough to change the picture.
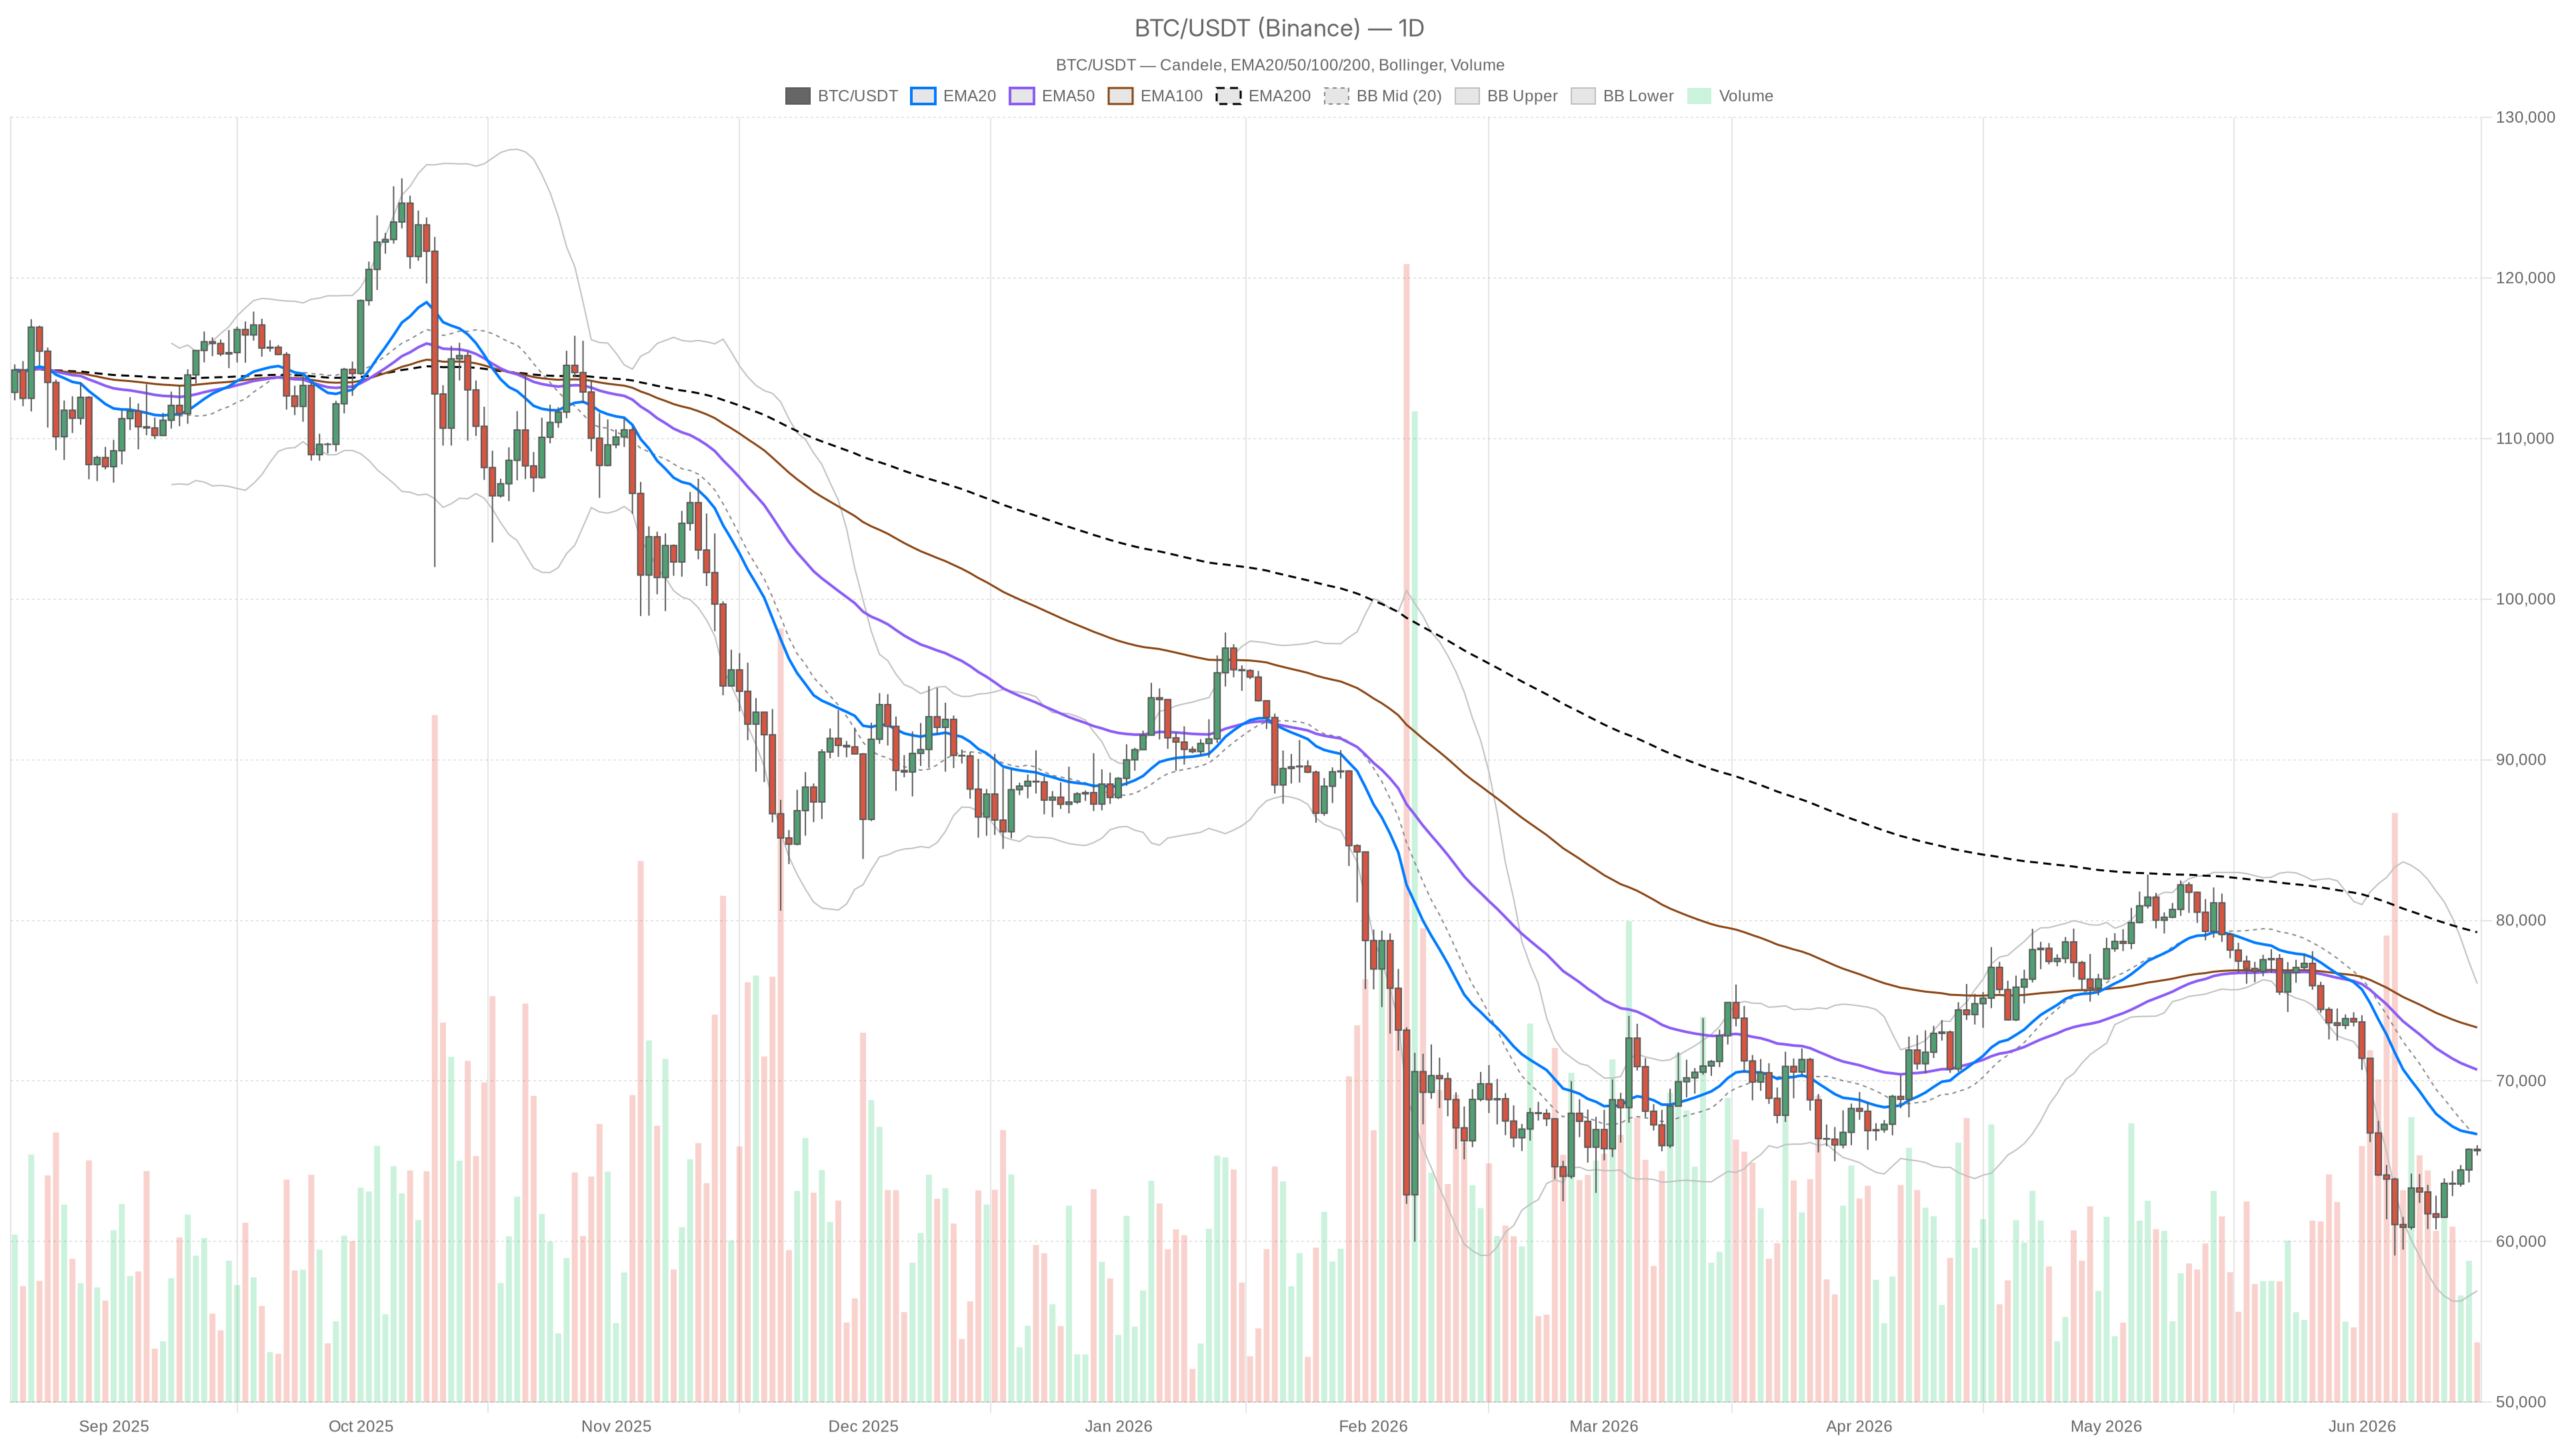 BTC/USDT — daily chart with candles, EMA20/EMA50 and volumes.
Key points
- Bitcoin is trading at $65,654, below the daily EMA20 at $66,686
- Daily RSI at 41.41: structural weakness without technical oversold
- The US-Iran agreement on the Strait of Hormuz has catalyzed the rebound of the last few hours
- Fear & Greed Index at 20 (Extreme Fear), total market cap at $2.33 trillion
- Timeframe conflict: daily bearish, hourly bullish, 15 minutes neutral
The background picture: bearish trend, fragile rebound
On the daily timeframe, the situation is clear and severe. The regime is classified as bearish and the exponential moving averages confirm this without ambiguity: EMA20 at $66,686, EMA50 at $70,698 and EMA200 at $79,259, all above the current price and ordered in a bearish sequence. Bitcoin cannot even get close to the 20-period average. Every recovery attempt therefore has to face a nearby dynamic resistance.
The 14-period RSI stands at 41.41, territory below the equilibrium zone but without technical oversold. In structured bearish trends, this value can remain compressed for a long time without generating reversal signals. The daily MACD shows a line that is still deeply negative. However, the histogram at +471 indicates that the negative momentum is decelerating: the selling pressure is temporarily running out, without this implying a structural reversal.
The Bollinger Bands place the price in the lower half of the channel: middle band at $66,497, lower band at $56,930. With a 14-period ATR of $2,651, the potential volatility per session remains high. The price is squeezed below the middle band and cannot reclaim it, a sign that downward pressure remains structurally present.
The conflict between timeframes: the hourly tells a different story
On the 1-hour timeframe, instead, the regime is classified as bullish. The hourly EMAs are aligned in an upward fashion: EMA200 at $63,775, EMA50 at $64,634 and EMA20 at $65,206, all below the current price. Bitcoin has already established a short-term uptrend, confirmed by an RSI at 63.72 and by a MACD with a positive histogram at +53.9, which shows momentum still expanding.
On the 15-minute chart, however, the regime is neutral and the MACD shows a negative histogram at -42.86: the price is losing momentum in the very short term. The RSI at 49 is flat, without direction. The Bollinger Bands compress the range between $65,587 and $65,948, a tight zone that often precedes an explosive move. The pivot points confirm the balance: PP at $65,700, R1 at $65,763, S1 at $65,601.
That said, this is the classic conflict between timeframes that every trader must know how to manage: the daily says the structure is bearish, the hourly says the rebound has legs, the 15 minutes signals that the push is cooling down. It is not a contradiction that can be solved with one more indicator: it requires operational discipline.
Sentiment confirms the fragility of the moment
The Fear & Greed index is at 20 — Extreme Fear. Historically this level precedes accumulation phases or at least stabilization, but it is also the ground where rallies lack genuine participation and fade quickly. Bitcoin dominance at 56.6% (CoinGecko data) confirms that capital remains concentrated on BTC. There is no rotation into altcoins, a sign that the market’s risk appetite is still cautious despite the rebound of the last few hours. Total market capitalization is about $2.33 trillion, with a 1.9% increase over the last 24 hours: a modest recovery, not a structural turning point.
Scenarios: what is needed for the upside and what the risks are
For the current rebound to become something more structural, Bitcoin must first convincingly break above the daily EMA20 at $66,686 with a sustained daily close above that level. The next natural target would be the $68,000–70,000 area, where selling pressure becomes more intense. The bullish scenario is invalidated below $64,000, which represents the critical support of the hourly move.
To the downside, instead, the bearish structure on the daily remains dominant as long as the price does not reverse the key averages. If the rally deflates, as the 15 minutes seems to suggest with its negative MACD, the level to watch is the lower band of the daily Bollinger Bands around $56,930, with important intermediate supports in the $62,000–63,000 area. A decisive break of $63,500 with a daily close below that zone would trigger an accelerated bearish scenario.
How to read this moment
The agreement on the Strait of Hormuz has provided a technical pretext for the rebound, but the market remains in a fragile transition. Those operating on the daily have to deal with a structure that has not yet changed: bearish moving averages, RSI outside the qualified rebound zone, sentiment dominated by fear. Those following the hourly timeframe have on their side a genuine short-term momentum, but must be aware that they are trading against the larger trend.
The main risk in this configuration is the false breakout: a test of $66,500–67,000 that attracts buyers only to then sharply reverse, leaving long traps open. The level around the daily pivot at $65,669 is exactly where the price is now: a zone of maximum indecision, not of clear opportunity. In markets dominated by extreme fear, patience is worth more than anticipation.
FAQ
What is the price of Bitcoin today, June 15, 2026?
Bitcoin is trading at $65,654, in a zone of precarious balance above the daily pivot point, but below all the main exponential moving averages on the daily timeframe.
Is the Bitcoin trend bullish or bearish?
On the daily, the trend is bearish, with EMA20, EMA50 and EMA200 aligned in a bearish sequence above the price. On the hourly timeframe, instead, a short-term bullish rebound is underway, but it is moving against the larger picture.
What caused Bitcoin’s rebound in the last few hours?
The US-Iran agreement on the Strait of Hormuz has eased global geopolitical pressure, temporarily pushing capital towards risk assets and providing a catalyst for the short-term bullish move.
What are the key levels to watch?
Immediate resistance at $66,686 (daily EMA20); critical support at $64,000 for the hourly bullish scenario. To the downside, the $62,000–63,000 area as intermediate support and $56,930 as the target of the lower band of the daily Bollinger Bands.
{“@context”:”https://schema.org”,”@type”:”FAQPage”,”mainEntity”:[{“@type”:”Question”,”name”:”What is the price of Bitcoin today, June 15, 2026?”,”acceptedAnswer”:{“@type”:”Answer”,”text”:”Bitcoin is trading at $65,654, in a zone of precarious balance above the daily pivot point, but below all the main exponential moving averages on the daily timeframe.”}},{“@type”:”Question”,”name”:”Is the Bitcoin trend bullish or bearish?”,”acceptedAnswer”:{“@type”:”Answer”,”text”:”On the daily, the trend is bearish, with EMA20, EMA50 and EMA200 aligned in a bearish sequence above the price. On the hourly timeframe, instead, a short-term bullish rebound is underway, but it is moving against the larger picture.”}},{“@type”:”Question”,”name”:”What caused Bitcoin’s rebound in the last few hours?”,”acceptedAnswer”:{“@type”:”Answer”,”text”:”The US-Iran agreement on the Strait of Hormuz has eased global geopolitical pressure, temporarily pushing capital towards risk assets and providing a catalyst for the short-term bullish move.”}},{“@type”:”Question”,”name”:”What are the key levels to watch?”,”acceptedAnswer”:{“@type”:”Answer”,”text”:”Immediate resistance at $66,686 (daily EMA20); critical support at $64,000 for the hourly bullish scenario. To the downside, the $62,000–63,000 area as intermediate support and $56,930 as the target of the lower band of the daily Bollinger Bands.”}}]}
Disclaimer: This article is for informational purposes only and does not constitute financial advice, investment recommendation or a solicitation to buy or sell financial instruments or cryptocurrencies. The analyses do not guarantee future results. Investments in crypto-assets and financial markets involve a high risk of loss of capital. Always do your own research (DYOR) and consult a qualified financial advisor before making any decision.
Content created with the assistance of artificial intelligence and with human editorial review.


You May Also Like

Vitalik Buterin Proposes Self-Sovereign AI Stack To Protect Users From Risks Of AI Agents

Why Businesses Need Professional Machine Design and Development Services

Standard Chartered Sees Tokenization Driving DeFi Toward $2.7 Trillion by 203


