

Tron Hits $80.2B Stablecoin Milestone After Tether Mints 1B USDT On The Network
the heldTron has emerged as one of the strongest performers during the latest market downturn, showing a level of resilience rarely seen among major altcoins. While most large-cap cryptocurrencies have suffered drawdowns of 40% or more since August, Tron has limited its losses to just 24%, outperforming nearly the entire altcoin sector. This relative strength highlights the network’s unique positioning and the steady demand it continues to attract despite broader market weakness.
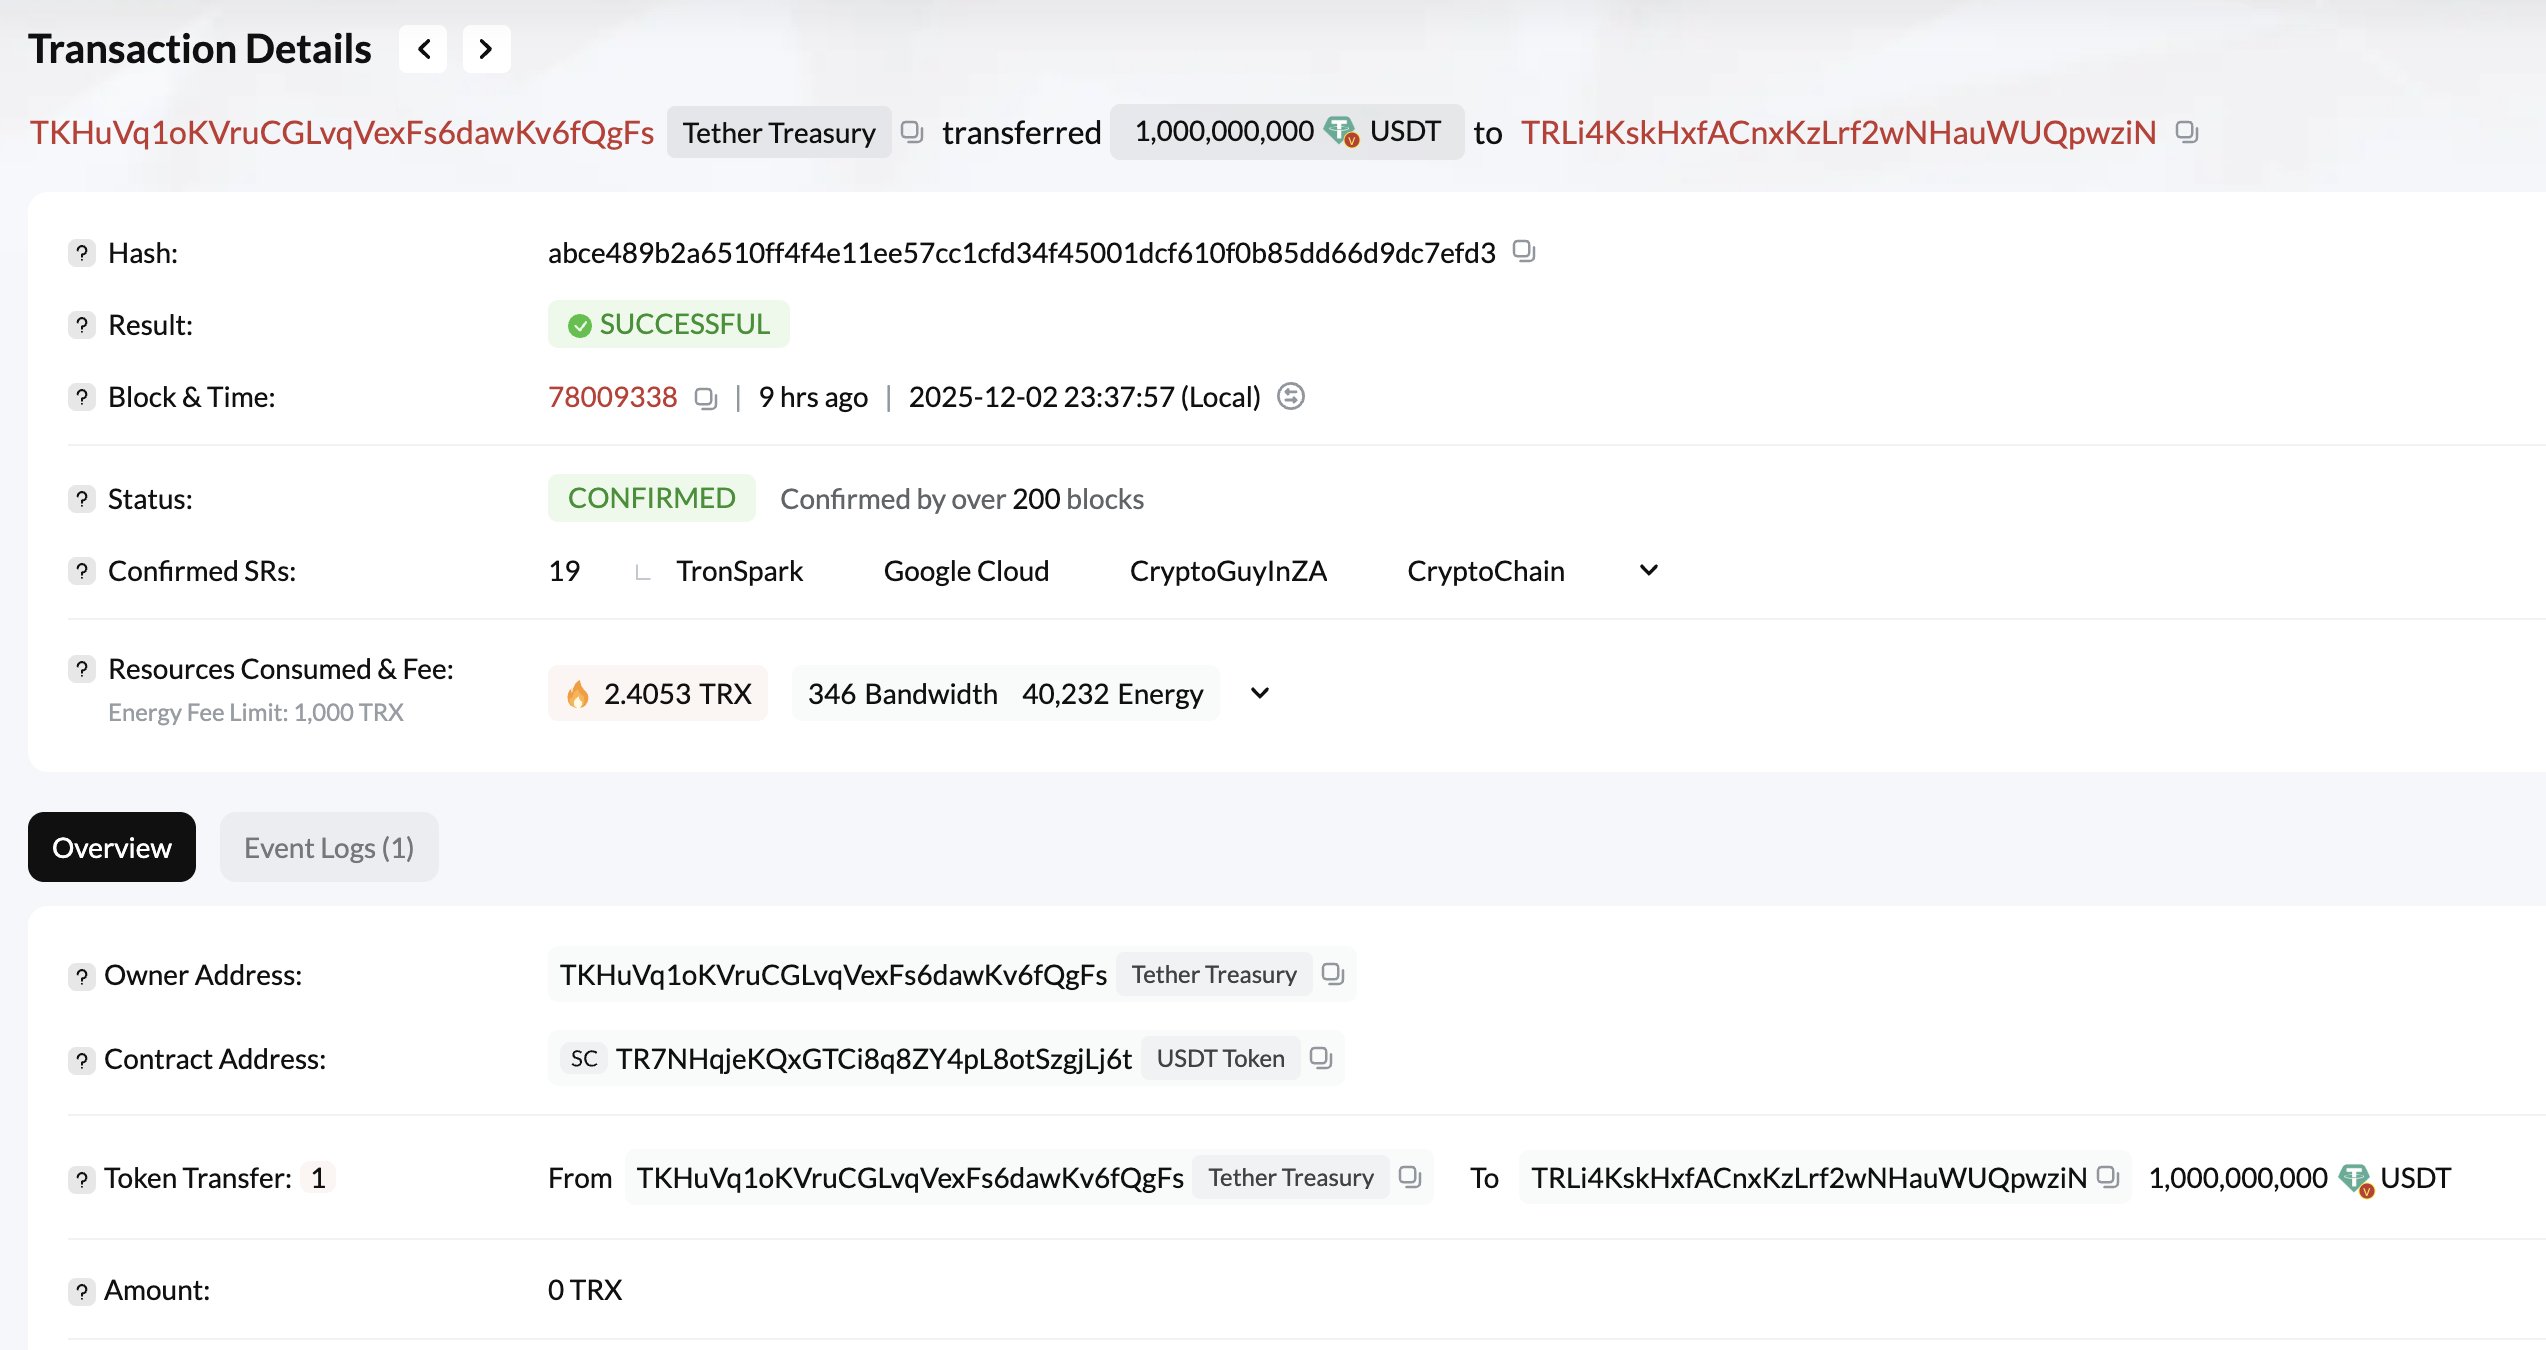
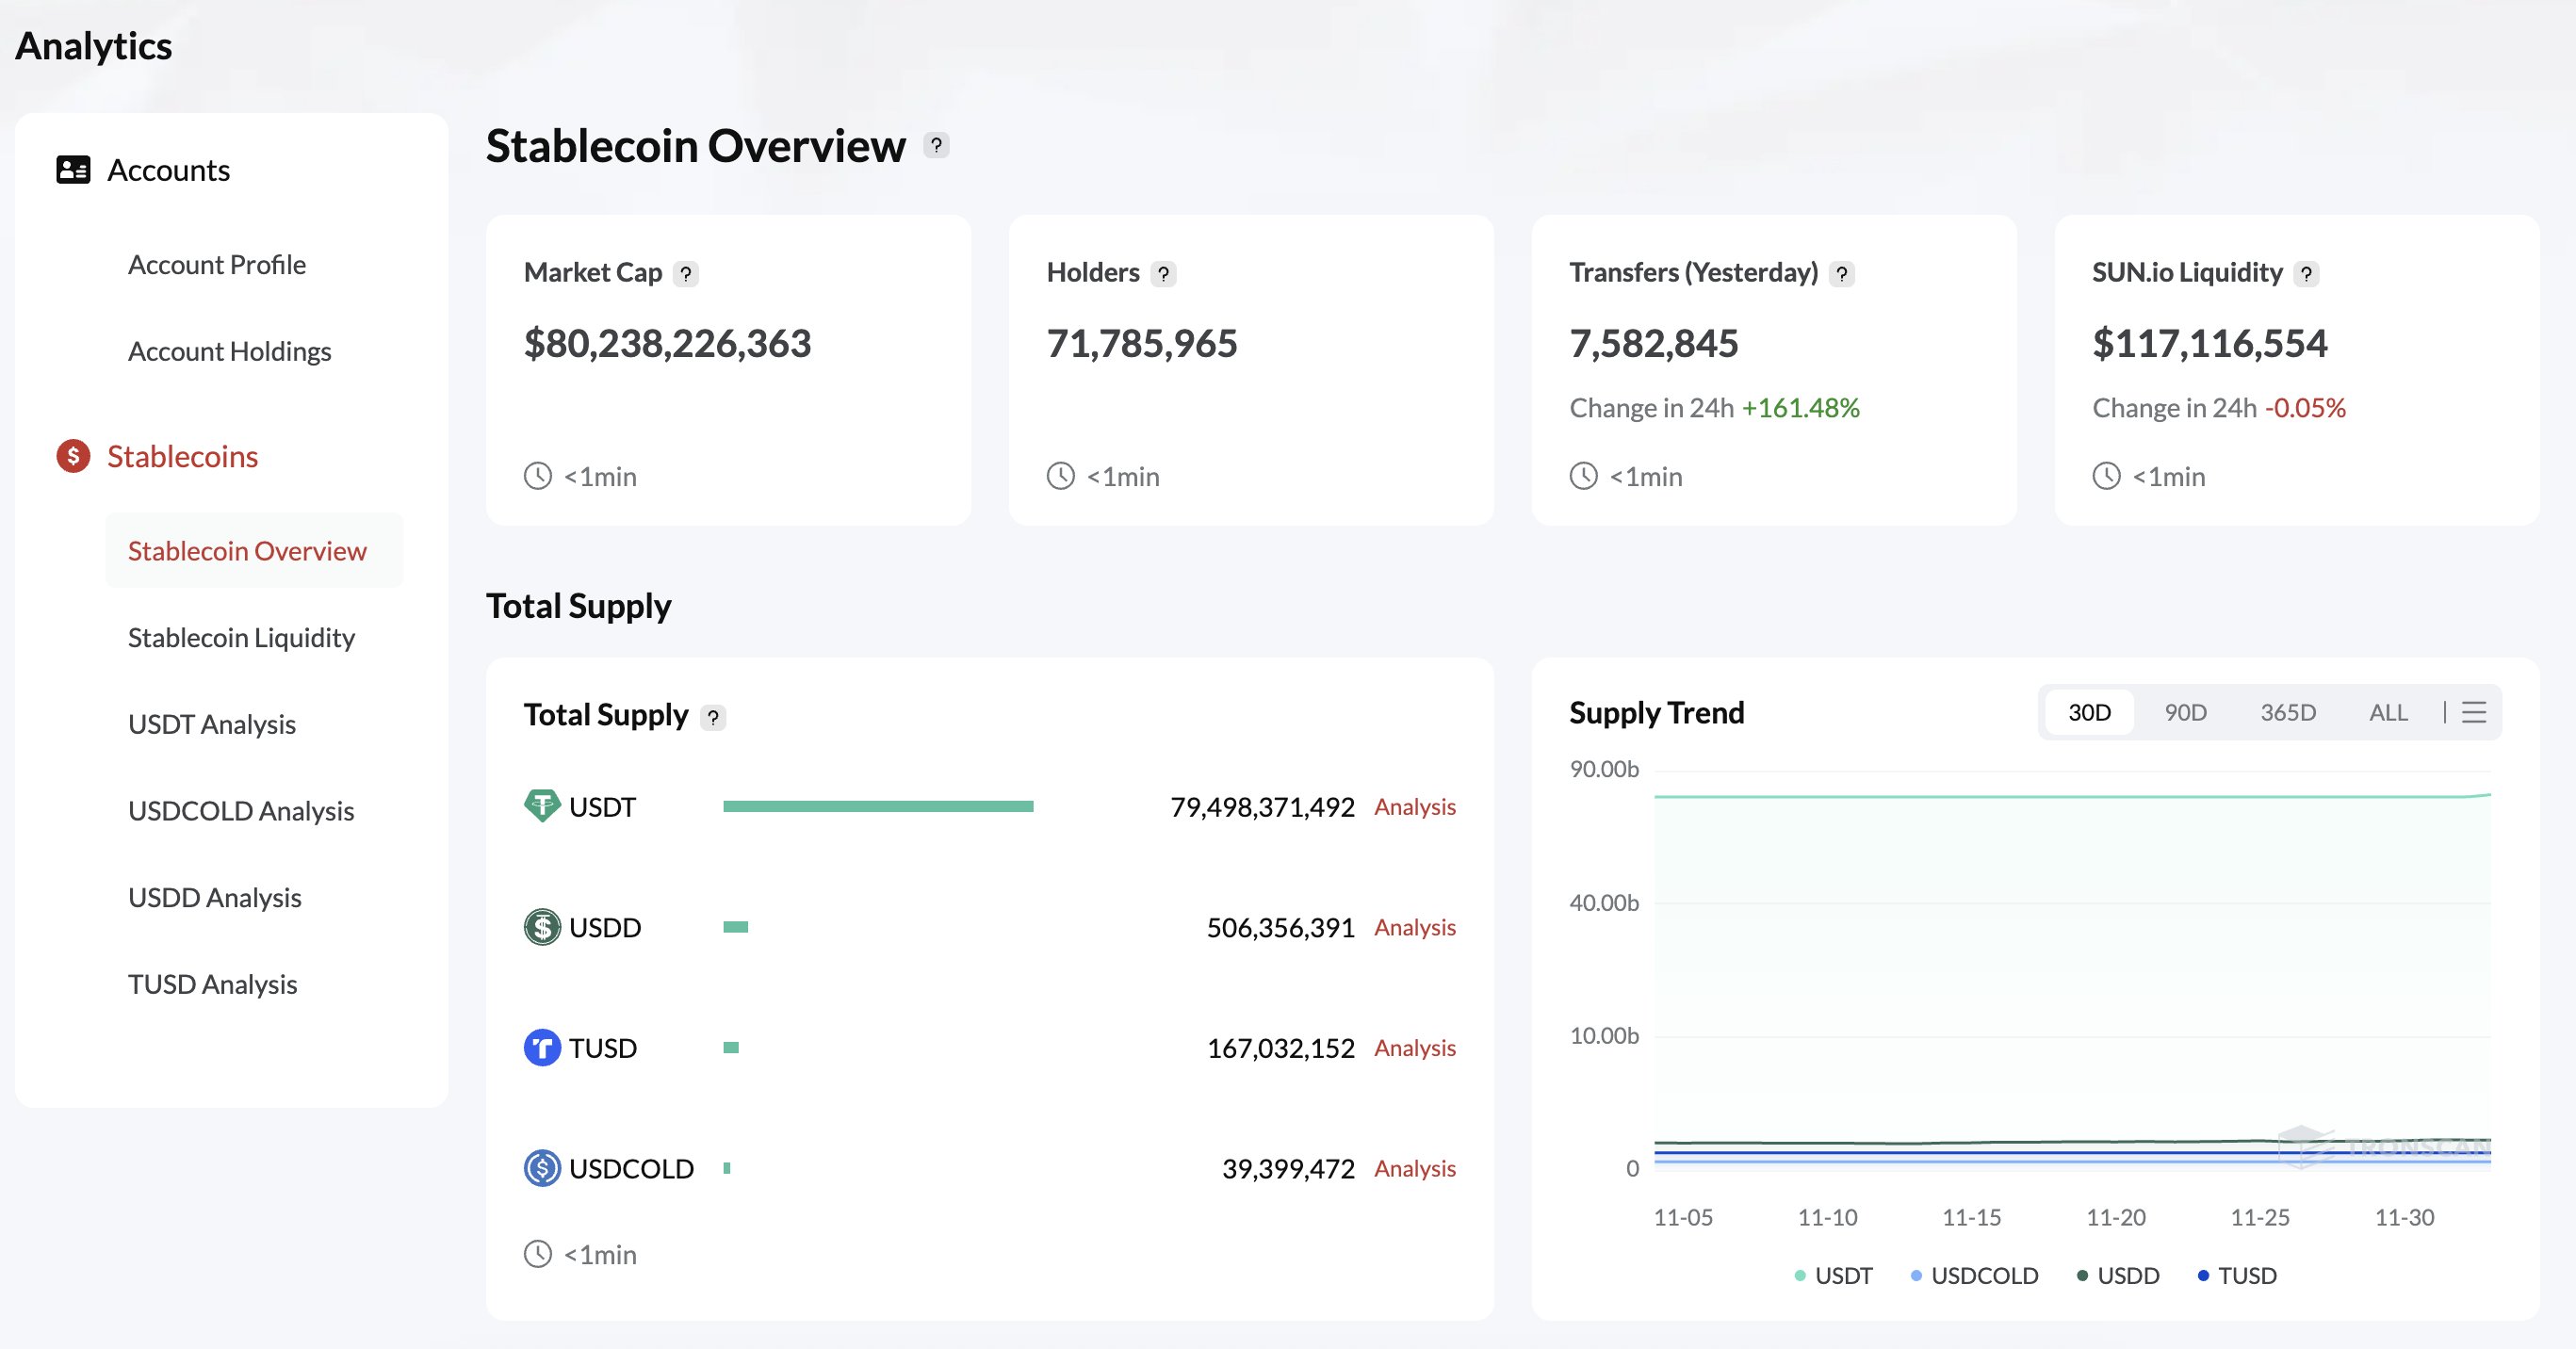
A major factor behind this resilience is Tron’s growing dominance in the stablecoin ecosystem. According to data from Tronscan, shared by Lookonchain, Tether minted another 1 billion USDT on Tron, signaling continued confidence in the network’s ability to handle large-scale stablecoin issuance. This new mint has pushed Tron’s stablecoin market cap above $80.2 billion, solidifying its role as the leading chain for USDT circulation.
As capital rotates defensively into stablecoins, Tron tends to benefit disproportionately. Its ability to maintain relative stability while the rest of the market capitulates reinforces the idea that Tron’s utility-driven demand remains intact—and may continue to offer support even if volatility persists.
Tron Strengthens Its Position as the Second-Largest Stablecoin Network
Tron has become a central pillar of the global stablecoin ecosystem, securing its position as the second-largest blockchain for stablecoin activity. Its appeal comes from fast settlement times, extremely low transaction fees, and deep liquidity—features that make it the preferred network for high-volume USDT transfers, especially across exchanges, OTC desks, and remittance corridors.
This infrastructure has allowed Tron to attract massive stablecoin flows, with its total stablecoin market cap now exceeding $80.2 billion, largely driven by Tether’s continual issuance on the network.
However, despite Tron’s remarkable growth, Ethereum still dominates the stablecoin landscape, maintaining a market cap of roughly $166 billion, which is nearly double that of Tron. Ethereum’s dominance is supported by its broader DeFi ecosystem, institutional presence, and the higher-value activity that takes place through smart contracts, lending protocols, and on-chain financial applications.
Stablecoins on Ethereum often serve as liquidity for sophisticated trading and yield strategies, whereas on Tron, they are primarily used for settlement, payments, and exchange flows.
The two ecosystems complement different market needs. Ethereum anchors the institutional and DeFi-driven segment of stablecoin usage, while Tron leads in high-throughput, cost-efficient transactions. As stablecoin demand grows globally, both networks continue to reinforce their positions. One through scalability and speed, the other through DeFi depth and capital concentration.
TRX Holds Strong Weekly Structure Despite Volatility
Tron’s weekly chart shows a notable level of resilience compared to broader market conditions. While many altcoins have experienced far deeper drawdowns, TRX has held above the $0.27–$0.28 support zone. Maintaining a strong higher-timeframe structure. The recent correction pulled the price down from the $0.36 region, but TRX continues to trade comfortably above the 50-week SMA. Which now sits around $0.28 and acts as immediate dynamic support.
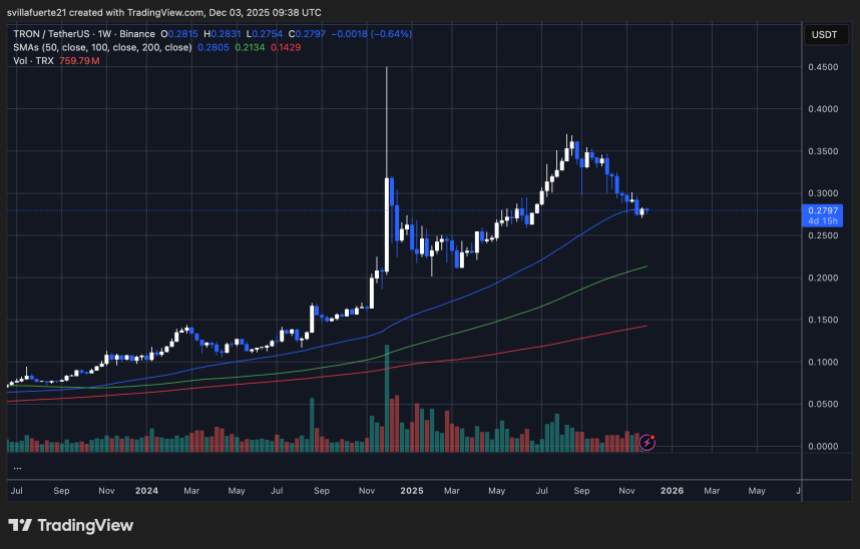
This strength is significant. Throughout 2025, TRX has respected its rising moving averages. The 50-week SMA in particular has provided consistent support during each market pullback. The 100-week and 200-week SMAs, positioned well below the current price, show a broad, healthy long-term uptrend that remains intact.
For Tron to regain bullish momentum, it must reclaim the $0.30–$0.32 region. Which served as support during the previous uptrend and now acts as resistance. A strong weekly close above this zone could open the door for a retest of the $0.34–$0.36 highs. Until then, TRX remains one of the market’s more stable performers, showing controlled downside and structural strength.
Featured image from ChatGPT, chart from TradingView.com


You May Also Like

Wolfx Crypto Signals Review: Unraveling the Reality

Claude Mythos: Anthropic’s 244-page system card unlocks new safety disclosures


