Ethereum Deploys Record 8.7M Contracts in Q4 2025: What’s Next for ETH?
The Ethereum network ETH $2 977 24h volatility: 1.4% Market cap: $359.63 B Vol. 24h: $19.16 B has seen a historical record in quarterly deployed smart contracts in Q4 2025, achieving over 8.7 million contracts.
This milestone highlights developer and startup activity growth around the Ethereum ecosystem.
Joseph Young, a known Ethereum analyst and content creator, shared this data on December 30, based on a Token Terminal chart.
He emphasized the “organic” nature of such a metric that is “hard to inflate,” in his words. Deployed contracts accounts for unique smart contracts published onchain and is “a proxy for the amount of new infrastructure or applications that are launched on the blockchain,” as described on Token Terminal.
Young explained the growth is driven by a rollup and layer-2 expansion, real-world asset (RWA) issuance, stablecoins, wallets, and intents. However, this metric only includes smart contracts deployed on Ethereum’s base layer (L1), while contracts on layer-2 networks are tracked separately.
Contracts Deployed on Ethereum: Historical Data
Quarterly deployed contracts were trending downwards in 2025, starting at nearly 6 million in Q1, down to 4.3 million and 3.1 million in Q2 and Q3, respectively.
2024 was a terrible year for this indicator, barely having less than 1.5 million deployed contracts in all quarters except for the 1.6 million in Q3.
Before the currently ending quarter, Q2 2021 had the former record of 6 million deployed smart contracts.
Meanwhile, Q4 2024 had the lowest amount of deployed contracts since Q2 2017, with only 528,100 new smart contracts.
In total, there have been 91.7 million contracts deployed on Ethereum, per Token Terminal data.
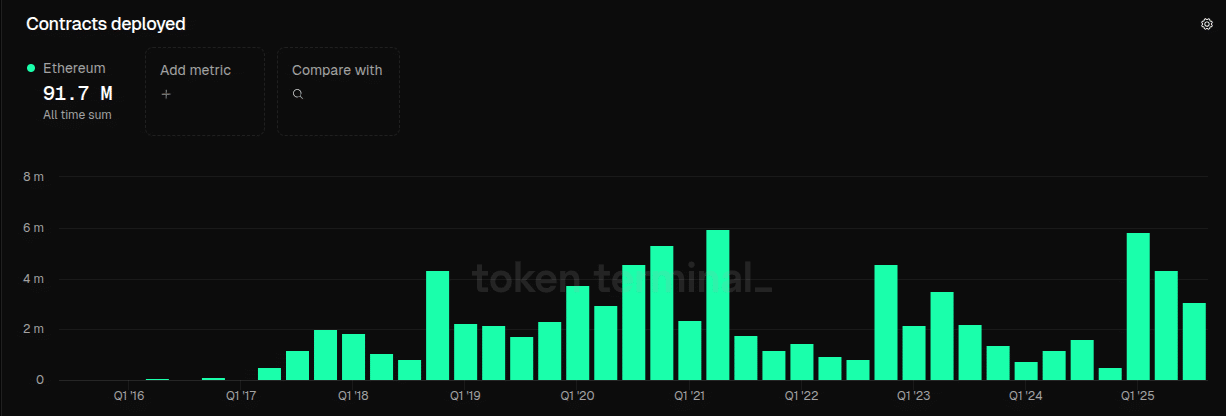
All-time quarterly deployed contracts on Ethereum, as of Dec. 30, 2025 | Source: Token Terminal
ETH Price Analysis and What’s Next
Ether (ETH), Ethereum’s native token, is currently trading at $2,980, inside a multi-year key support and resistance (S/R) level that goes from $2,800 to $3,000.
Breaking above this resistance could drive prices to ETH’s $4,957 all-time high, while breaking below it could make Ethereum test a lower support at around $2,500.
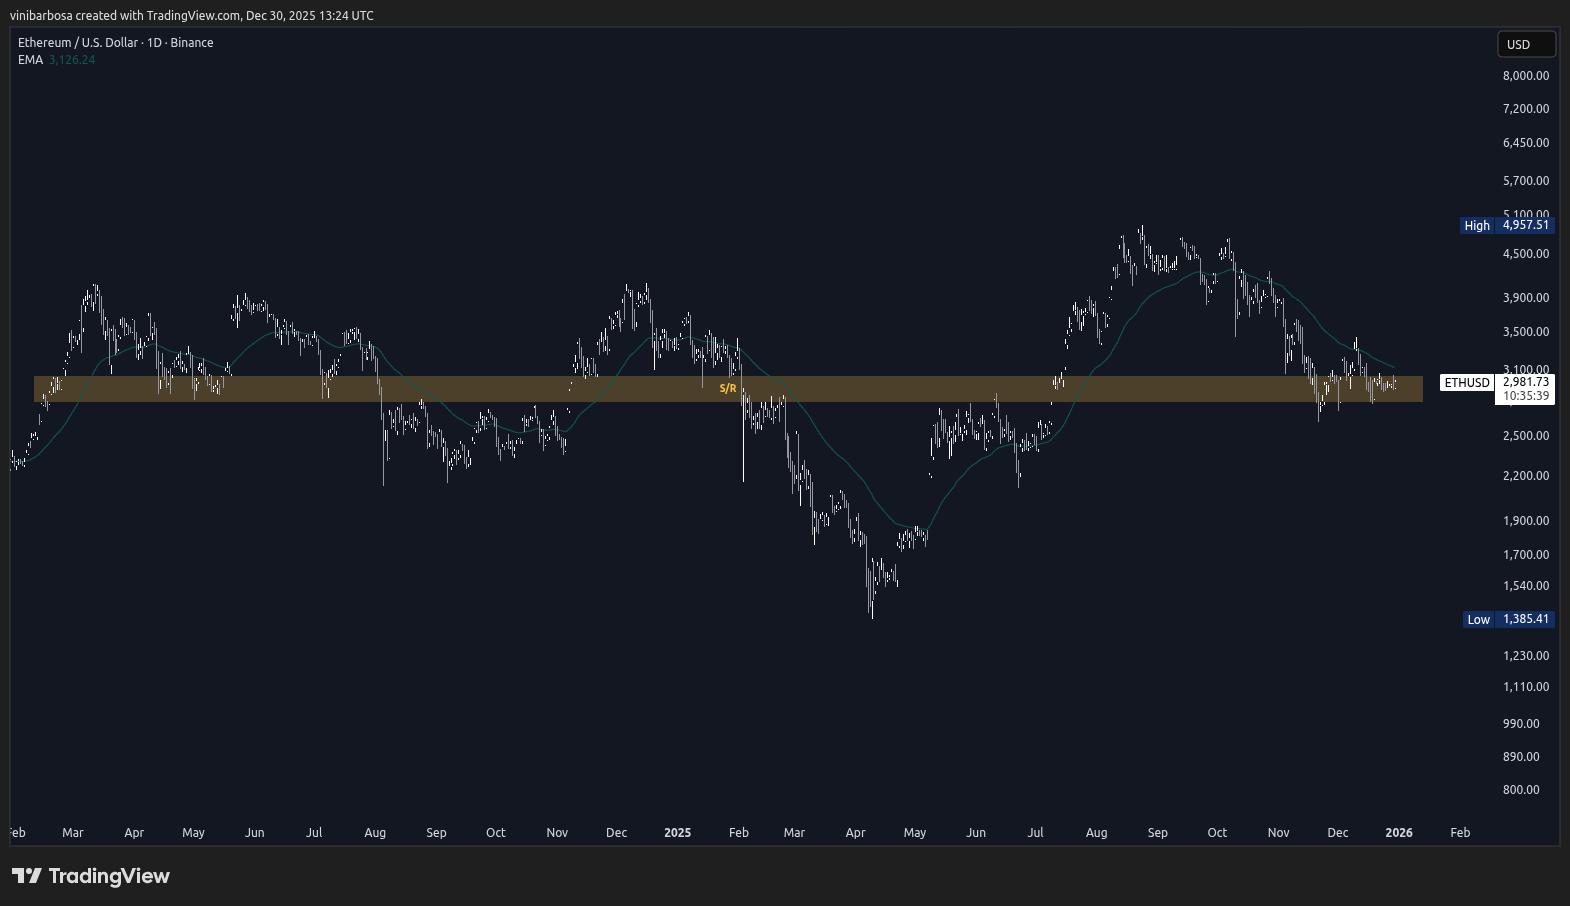
Ethereum (Ether, ETH) 1D price chart, as of Dec. 30, 2025 | Source: TradingView
Interestingly, ETH reached a significant local bottom at $1,385 in April 2025, two quarters after the record low Q4 2025 for deployed contracts, suggesting price could lag on contract activity.
Whether there is a real correlation or not, fewer contracts deployed indicate lower interest in the network overall, with could translate to fewer users and a smaller market demand for the token, while the opposite can be true.
As more infrastructure, applications, tools, and on-chain interactions grow on the network, developer activity rises through new contracts being deployed.
This can attract more users and increase demand for ETH to pay gas fees and secure the network through staking.
Despite the currently poor price action, other metrics are aligning to the contract deployment’s growth seen above.
Stablecoins are consistently making new market cap highs and analysts believe ETH could reach $8,500 under the right conditions.
Ethereum’s ecosystem is maturing through governance discussions like the approved UNIfication for Uniswap and the refused AAVE’s token alignment proposal with record participation from holders.
nextThe post Ethereum Deploys Record 8.7M Contracts in Q4 2025: What’s Next for ETH? appeared first on Coinspeaker.


You May Also Like

Oil reversal and crowded shorts keep crypto traders on edge

GBP/USD Stagnates Below 1.33 as Bank of England’s Critical Rate Decision Looms