TLDR SOL is down over 30% year-to-date, with every bounce since January fading into lower highs Funding rates have been negative for 21 weeks, mirroring a 2022 TLDR SOL is down over 30% year-to-date, with every bounce since January fading into lower highs Funding rates have been negative for 21 weeks, mirroring a 2022

Solana (SOL) Price: Sellers Are Flooding Exchanges — Is $65 Really on the Table?

2026/03/12 17:33
3 min read
For feedback or concerns regarding this content, please contact us at crypto.news@mexc.com

TLDR

  • SOL is down over 30% year-to-date, with every bounce since January fading into lower highs
  • Funding rates have been negative for 21 weeks, mirroring a 2022 pattern that later led to a major rally
  • Open interest has collapsed from $7.58 billion to $1.9 billion, meaning short squeeze fuel is thin
  • Exchange inflows surged 800% since February, from 245,691 SOL to over 2.2 million SOL daily
  • Key support levels sit at $82 and $75, with $65 as a possible deeper target if those break

Solana has been relatively flat over the past 30 days, down just 1.4%. But the bigger picture tells a different story. SOL is down more than 30% since January 1, 2026, and each rally attempt has failed at a lower level than the one before.
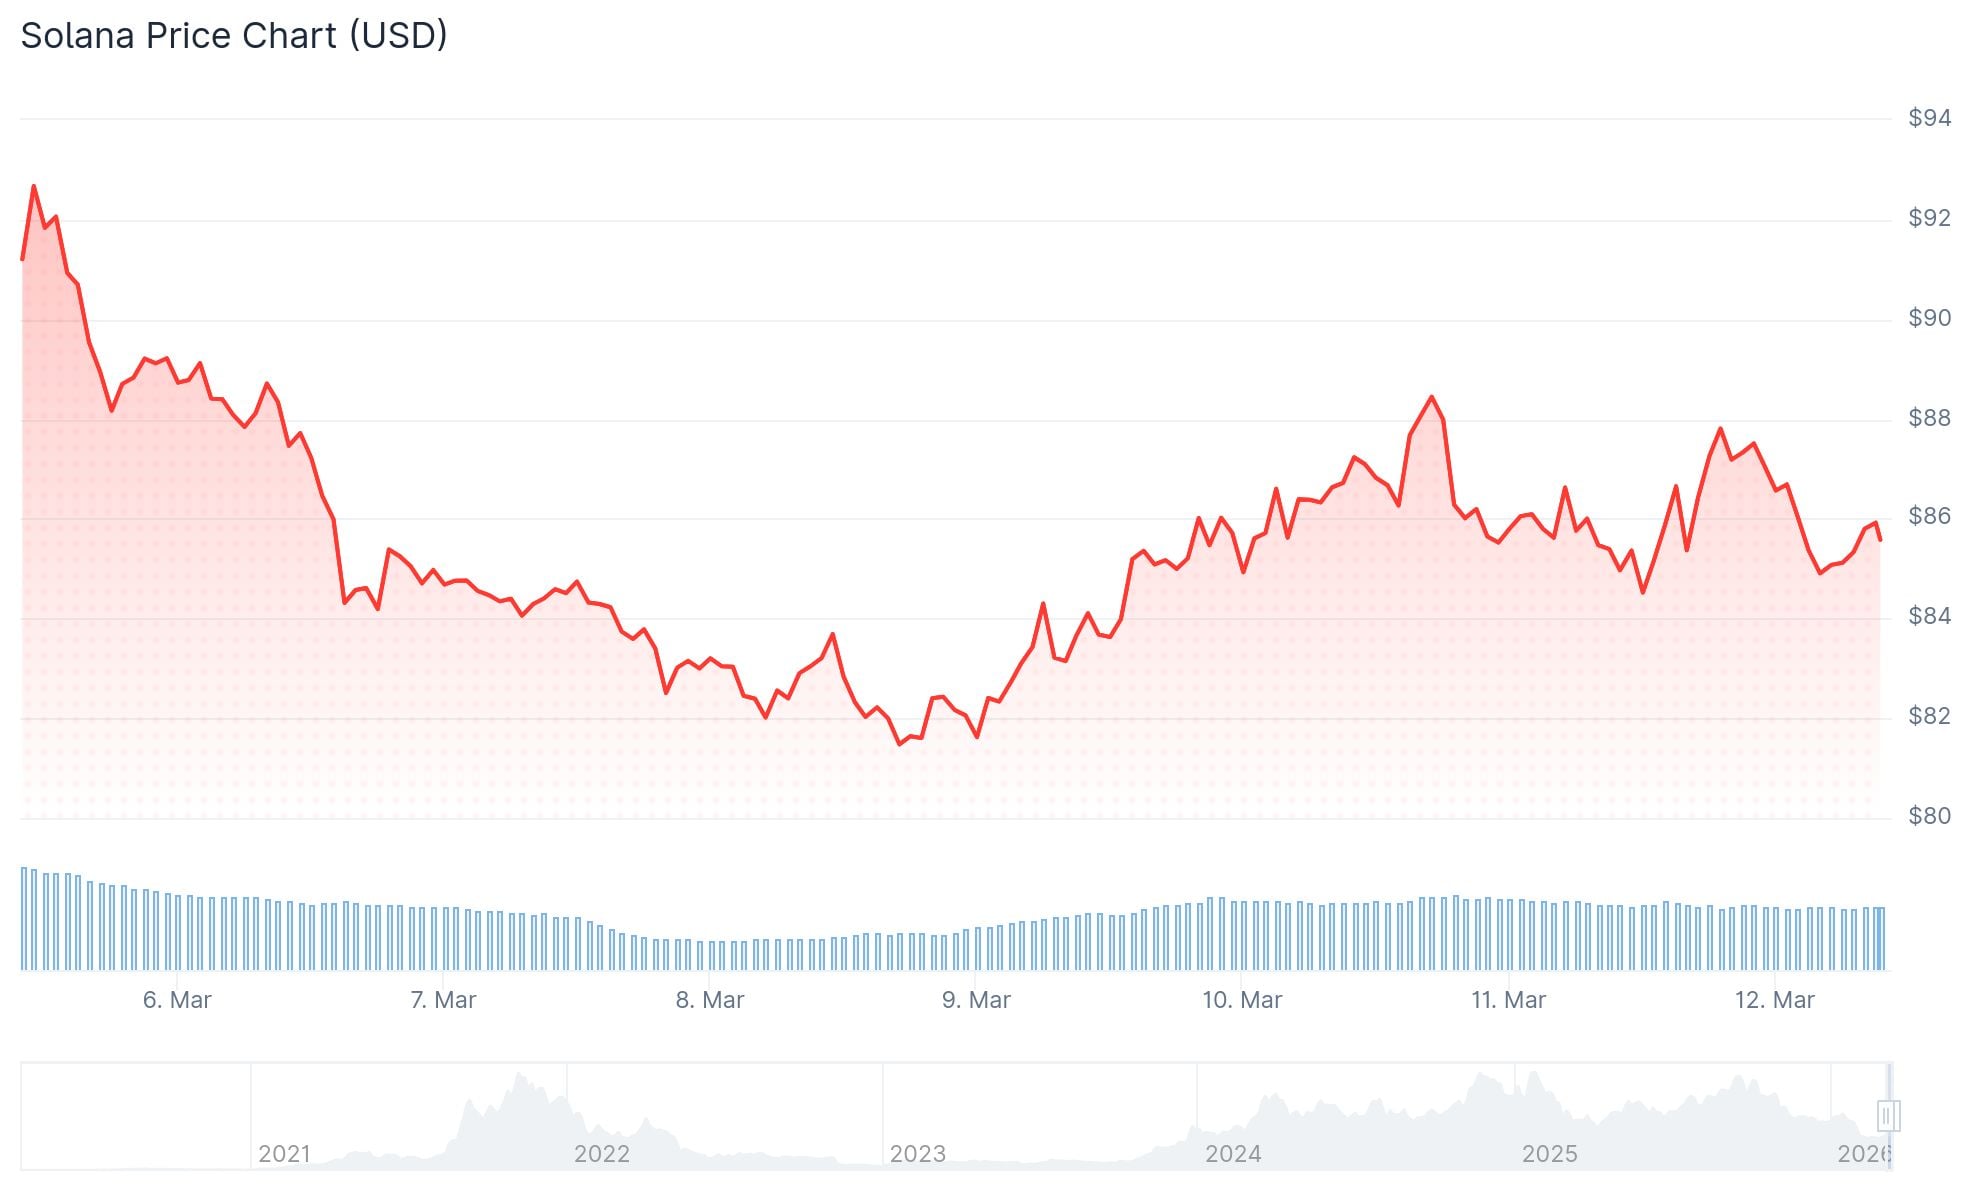
Solana (SOL) PriceSolana (SOL) Price

The market’s short-term calm is masking some real pressure building underneath.

One key derivatives metric — the funding rate — has been negative for 21 straight weeks. A negative funding rate means short sellers are paying long holders to keep positions open. This signals that bearish bets are dominating.
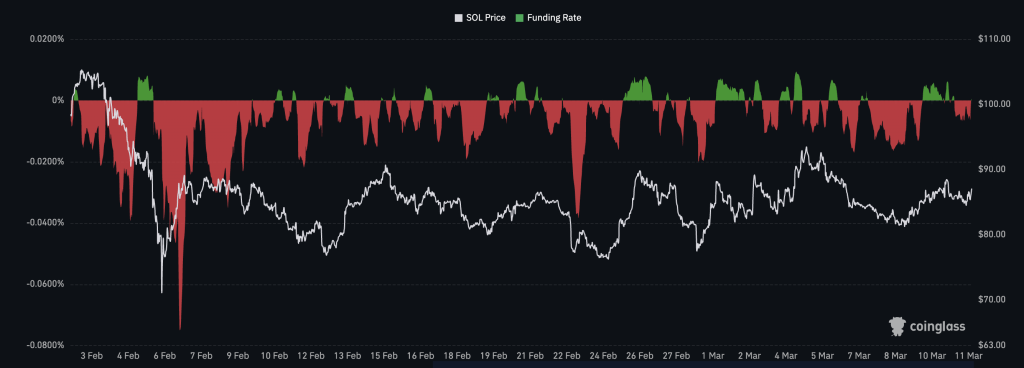
Source: Coinglass

This same pattern showed up between February 2022 and February 2023, a 53-week streak. During that stretch, SOL dropped to a cycle low of $7. But as that streak ended, price quietly began to recover — eventually rallying to $209 by March 2024.

The current 21-week streak looks similar in structure. But there is a key difference.

Open Interest Has Dried Up

Open interest in SOL derivatives peaked at $7.58 billion in September 2025. Today it sits near $1.9 billion — the lowest since early March 2025. That is a collapse of roughly 75%.

Low open interest means there is not enough leveraged short positioning to trigger a meaningful short squeeze. Without that fuel, bounces tend to fizzle quickly.

On the chart, SOL has been trading inside an ascending channel since early February. That might look like a recovery, but the channel formed right after a sharp drop from $148 to $68. Analysts say this makes it a continuation pattern — not a reversal.

Daily Ascending ChannelSource: TradingView

Exchange Inflows Are Climbing Fast

On-chain data adds more weight to the bearish case. Exchange net inflows for Solana have been positive every single day since February 10. On that date, daily inflows were around 245,691 SOL. By March 10, they had reached 2,204,783 SOL — an increase of roughly 800% in one month.

Tokens flowing onto exchanges typically means holders are preparing to sell.

For a real bottom to form, analysts say these inflows would need to reverse into sustained outflows. That has not happened yet.

Key support levels on the chart sit at $82, then $79. If those break, the measured move from the channel points toward $65.

On the upside, a daily close above $94 would break the sequence of lower highs. A move above $118 would be needed to confirm a full bullish reversal.

As of March 11, 2026, SOL trades near $85, with exchange inflows still rising and open interest remaining near multi-month lows.

The post Solana (SOL) Price: Sellers Are Flooding Exchanges — Is $65 Really on the Table? appeared first on CoinCentral.

Market Opportunity
Solana Logo
Solana Price(SOL)
$87.25
$87.25$87.25
+2.17%
USD
Solana (SOL) Live Price Chart
Disclaimer: The articles reposted on this site are sourced from public platforms and are provided for informational purposes only. They do not necessarily reflect the views of MEXC. All rights remain with the original authors. If you believe any content infringes on third-party rights, please contact crypto.news@mexc.com for removal. MEXC makes no guarantees regarding the accuracy, completeness, or timeliness of the content and is not responsible for any actions taken based on the information provided. The content does not constitute financial, legal, or other professional advice, nor should it be considered a recommendation or endorsement by MEXC.

You May Also Like

Unlimit Appoints Irene Skrynova as CEO, Global Payments

Unlimit Appoints Irene Skrynova as CEO, Global Payments

Unlimit announced the appointment of Irene Skrynova as CEO, Global Payments, as the company accelerates its evolution into a global financial infrastructure platform
Share
ffnews2026/03/12 18:17
Analyst Predicts ‘Uptober’ Rally for BTC Regardless of FOMC Decision

Analyst Predicts ‘Uptober’ Rally for BTC Regardless of FOMC Decision

The post Analyst Predicts ‘Uptober’ Rally for BTC Regardless of FOMC Decision appeared on BitcoinEthereumNews.com. Bitcoin traded at $116,236 as of 14:04 UTC on Sept. 17, up about 1% in the past 24 hours, holding above a key level as markets await the Federal Reserve’s policy announcement. Analysts’ comments Dean Crypto Trades noted on X that bitcoin is only about 7% above its post-election local peak, while the S&P 500 has risen 9% and gold has surged 36% during the same period. He said bitcoin has compressed more than those assets, making it likely to lead the next larger move, though it could form a “lower high” before extending further. He added that ether could join in once it breaks $5,000 and enters price discovery. Lark Davis pointed to bitcoin’s history around September FOMC meetings, saying every September decision since 2020 — except during the 2022 bear market — has preceded a strong rally. He stressed that the pattern is less about the Fed’s rate choice itself and more about seasonal dynamics, arguing that bitcoin tends to thrive in this period heading into “Uptober.” CoinDesk Research’s technical analysis According to CoinDesk Research’s technical analysis data model, bitcoin rose about 0.9% during the Sept. 16–17 analysis window, climbing from $115,461 to $116,520. BTC reached a session high of $117,317 at 07:00 UTC on Sept. 17 before consolidating. Following that peak, bitcoin tested the $116,400–$116,600 range multiple times, confirming it as a short-term support zone. In the final hour of the session, between 11:39 and 12:38 UTC, BTC attempted a breakout: prices moved narrowly between $116,351 and $116,376 before spiking to $116,551 at 12:34 on higher volume. This confirmed a consolidation-breakout pattern, though the gains were modest. Overall, bitcoin remains firm above $116,000, with support around $116,400 and resistance near $117,300. Latest 24-hour and one-month chart analysis The latest 24-hour CoinDesk Data chart, ending 14:04 UTC on…
Share
BitcoinEthereumNews2025/09/18 12:42
UiPath (PATH) Stock Slides 5% Despite Crushing Earnings on Every Metric

UiPath (PATH) Stock Slides 5% Despite Crushing Earnings on Every Metric

TLDR UiPath beat Q4 estimates with EPS of $0.30 vs $0.26 expected, and revenue of $481M vs $465M expected The stock fell more than 5% in premarket trading despite
Share
Coincentral2026/03/12 18:09