Silver Price Forecast: XAG/USD Battles to Reclaim $85.00 as Critical Bearish Threats Loom
BitcoinWorld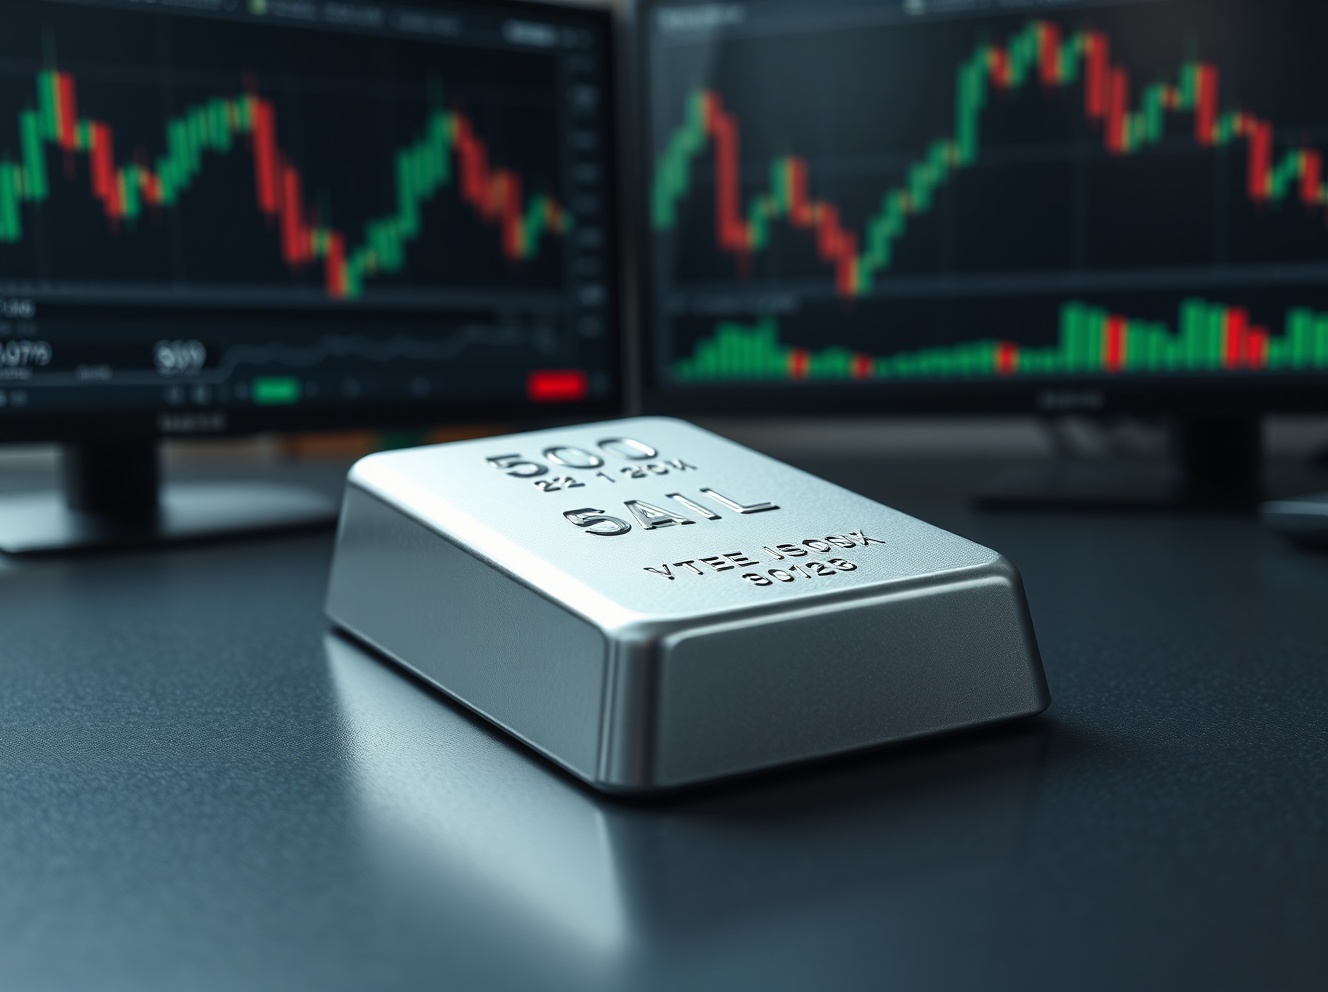
Silver Price Forecast: XAG/USD Battles to Reclaim $85.00 as Critical Bearish Threats Loom
Global silver markets witnessed a significant technical development this week as the XAG/USD pair managed to claw its way back above the psychologically important $85.00 per ounce threshold. This move, however, unfolds against a complex macroeconomic backdrop where persistent bearish risks continue to pressure the broader precious metals complex. Analysts are scrutinizing chart patterns, monetary policy signals, and industrial demand data to gauge whether this recovery represents a durable trend reversal or a temporary respite in a longer-term corrective phase.
Silver Price Forecast: Decoding the $85.00 Reclamation
The recent price action for silver, traded as XAG/USD, presents a classic case of technical resistance becoming support. After a period of consolidation below the $85.00 level, a combination of short-covering and renewed speculative interest propelled the metal higher. Consequently, market participants now view this zone as a critical pivot point. Furthermore, trading volumes have increased moderately during this ascent, suggesting a degree of conviction behind the move. However, historical data indicates that similar breakouts have failed without sustained fundamental drivers. Therefore, the current price environment requires careful examination of underlying momentum indicators.
Several key technical levels frame the immediate forecast. Firstly, initial resistance now appears near the $86.50 area, which aligns with a previous reaction high from last month. Secondly, a more formidable barrier sits around the $88.00 mark, coinciding with the 100-day simple moving average. On the downside, support is tentatively established at the recently conquered $85.00 level, with a more critical floor near $83.20. A daily close below $83.20 would likely invalidate the current bullish structure and signal a retest of lower supports. The Relative Strength Index (RSI), currently hovering near 55, suggests room for further upward movement before reaching overbought territory.
Macroeconomic Headwinds and Industrial Demand Dynamics
Beyond the charts, the fundamental landscape for silver remains fraught with crosscurrents. Primarily, the monetary policy trajectory of major central banks, especially the U.S. Federal Reserve, exerts immense influence. Higher-for-longer interest rate expectations bolster the U.S. dollar and increase the opportunity cost of holding non-yielding assets like silver. Recent commentary from Fed officials has reinforced a data-dependent but cautious stance, maintaining pressure on precious metals. Simultaneously, global growth concerns, particularly stemming from manufacturing slowdowns in key economies, threaten the industrial demand that constitutes over half of silver’s consumption.
Conversely, several supportive factors provide a counterbalance. Notably, sustained geopolitical tensions continue to foster safe-haven demand within the commodity spectrum. Additionally, the global transition towards green energy infrastructure underpins long-term structural demand for silver in photovoltaic (PV) solar panels and electric vehicles. Market data from institutions like the Silver Institute indicates that photovoltaic demand hit a record high last year and is projected to grow again in the current year. This creates a fundamental floor under prices, even during periods of financial market stress.
Expert Analysis and Market Sentiment Indicators
Market sentiment, as gauged by the Commitments of Traders (COT) reports from the Commodity Futures Trading Commission (CFTC), reveals a nuanced picture. Recently, managed money positions have shifted from a net short to a modest net long stance, reflecting the change in short-term momentum. However, the commercial hedge position—often considered the “smart money”—remains heavily net short, indicating producer selling into price strength. This divergence typically signals caution and suggests that professional entities view rallies as selling opportunities. Veteran commodity analysts often highlight this commercial hedging activity as a reliable contrarian indicator during trend transitions.
Furthermore, physical market indicators provide tangible evidence of underlying conditions. Premiums for silver bullion products at major mints and distributors have remained stable, indicating adequate supply and balanced two-way interest. ETF holdings for funds like the iShares Silver Trust (SLV) have shown minor outflows over the past quarter, reflecting a cautious but not panicked investment stance. When combined, these data points paint a picture of a market in equilibrium, lacking the explosive physical buying or frantic investment demand needed to fuel a sustained bull run without a fresh macroeconomic catalyst.
Comparative Performance and the Gold-Silver Ratio
An essential analytical tool for silver forecasters is the gold-silver ratio, which measures how many ounces of silver are needed to purchase one ounce of gold. Historically, this ratio averages around 60:1 but has been elevated recently, trading above 80:1. This high ratio suggests silver is undervalued relative to gold. A mean-reversion move, where the ratio declines, would require silver to outperform gold. Some analysts argue that a breakout in silver above key resistance could trigger such a mean-reversion trade, attracting momentum investors. The following table summarizes key technical and fundamental factors:
| Factor | Bullish Implication | Bearish Implication |
|---|---|---|
| Price Above $85.00 | Technical breakout, psychological support | Potential false breakout if not sustained |
| Fed Policy | Pivot to rate cuts would be highly supportive | Higher rates strengthen USD, pressure metals |
| Industrial Demand | Record PV demand provides structural support | Global manufacturing slowdown threatens demand |
| Gold-Silver Ratio | High ratio suggests potential for outperformance | Ratio can remain elevated for extended periods |
In summary, the path forward for silver prices hinges on the interplay between these competing forces. A clean hold above $85.00, followed by a breach of the $86.50-$88.00 resistance zone, could open the door for a test of the $90.00 level. Conversely, failure to maintain this footing would likely see the market retrace towards the $83.20 support, confirming the persistence of the broader bearish risks that analysts continue to monitor.
Conclusion
The silver price forecast remains delicately balanced following the XAG/USD pair’s recovery above $85.00. While the technical picture has improved in the short term, significant bearish risks persist, anchored by restrictive monetary policy and uncertain global industrial demand. The market’s next directional move will likely be determined by its ability to conquer overhead resistance or its failure to defend newfound support. Traders and investors should therefore watch the $85.00 level closely, as it now serves as the primary battleground between bullish recovery hopes and bearish macroeconomic realities. The coming sessions will be critical in establishing whether this move marks a genuine trend change or merely a pause within a larger corrective pattern.
FAQs
Q1: What does XAG/USD breaking above $85.00 mean for silver prices?
This break indicates a short-term victory for bullish momentum, turning a prior resistance level into potential support. However, it must be confirmed by sustained trading above this level and follow-through buying to signal a more durable trend reversal.
Q2: What are the main bearish risks for silver mentioned in the forecast?
The primary risks include a persistently strong U.S. dollar fueled by hawkish central bank policy, a global economic slowdown reducing industrial consumption, and continued selling pressure from commercial entities as reflected in futures market positioning.
Q3: How does industrial demand impact the silver price forecast?
Industrial demand, particularly from the solar panel sector, provides a fundamental floor for prices. Strong demand growth can offset financial market selling, while a slowdown removes a key pillar of support, making silver more vulnerable to macroeconomic headwinds.
Q4: What is the significance of the gold-silver ratio in this analysis?
A high gold-silver ratio, as seen currently, suggests silver is historically cheap relative to gold. A decline in this ratio would require silver to outperform, offering a potential bullish catalyst if investor sentiment shifts towards precious metals.
Q5: What key price level should traders watch if the $85.00 support fails?
A daily close below $85.00 would shift focus to the next major support zone around $83.20. A breach of that level would significantly strengthen the bearish case and likely trigger a test of lower supports near $80.00.
This post Silver Price Forecast: XAG/USD Battles to Reclaim $85.00 as Critical Bearish Threats Loom first appeared on BitcoinWorld.


You May Also Like

Fox News' fraud exposed: Inside the real-time con that's hollowing out America
Druckenmiller Dumped Alphabet, Slashed Amazon, and Bought Broadcom