SEI Prints Nine Consecutive Red Weeks as Price Tests Macro Channel Support
Selling pressure in Sei (SEI) has extended into a rare streak on the weekly timeframe, with the asset now recording nine consecutive red weekly candles.
The prolonged decline is pushing price toward a major structural area that traders are watching closely on the higher timeframe chart.
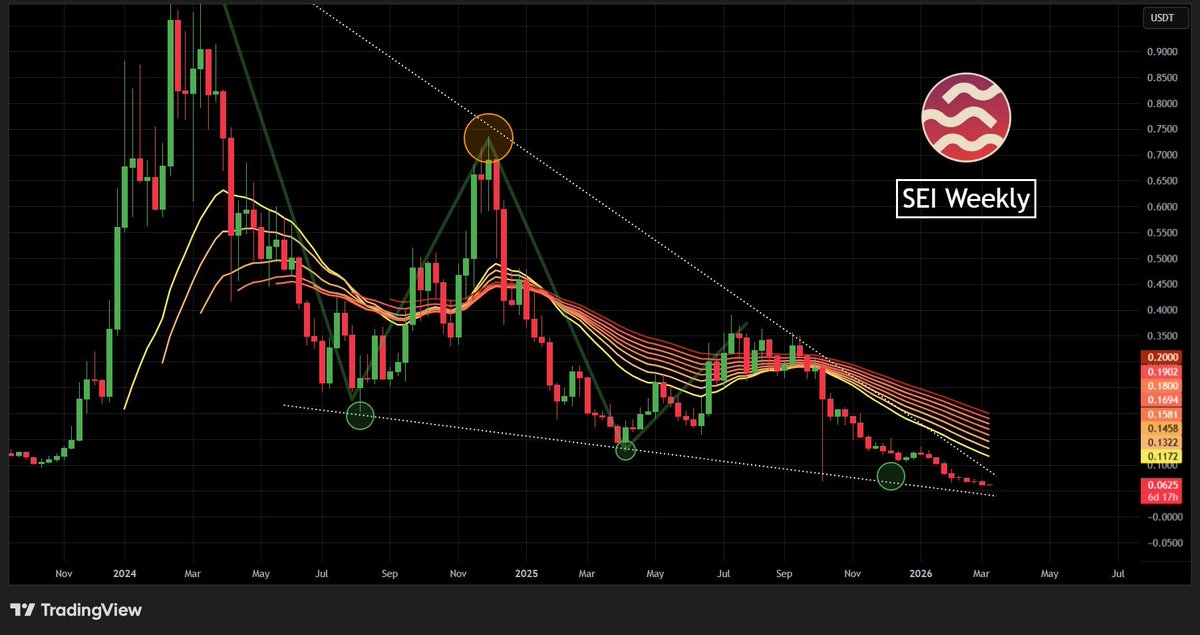
According to chart analysis shared by Bitcoinsensus, the recent sequence of losses suggests that SEI may be approaching the lower boundary of its long-term macro channel, a zone that has previously acted as structural support during earlier market phases.
At the time of the chart snapshot, SEI was trading around $0.062, continuing a gradual downtrend that has developed since the asset’s previous cycle highs.
Persistent Downtrend Defines Current Structure
The weekly chart shows a steady decline following the peak recorded during the earlier expansion phase of the market cycle.
Since that high, SEI has formed a clear series of lower highs and lower lows, confirming the continuation of a downward macro structure. The latest nine-week red streak reflects sustained selling pressure rather than isolated volatility.
Price is also trading below a cluster of moving averages on the weekly timeframe, which are currently sloping downward and acting as dynamic resistance levels.
This positioning indicates that rallies continue to encounter selling pressure before the market can regain meaningful upward momentum.
Macro Channel Support Comes Into Focus
Despite the persistent downtrend, the chart highlights a long-term descending channel, where the lower boundary has previously served as a reaction point for buyers.
SEI now appears to be approaching that support line again, suggesting the possibility of another test of the macro channel floor.
Based on the current structure, the chart indicates that the next potential downside area could lie within the $0.035 to $0.040 range if price continues moving toward the lower boundary of the channel.
Key Levels to Watch
Several structural levels stand out on the chart as the market approaches this potential support zone.
Immediate resistance appears around the declining moving average cluster between approximately $0.11 and $0.19, which currently caps any recovery attempts.
On the downside, the macro channel support highlighted on the chart aligns with the $0.035–$0.040 region, which could become the next major reaction area if selling pressure persists.
Market Approaching Technical Decision Point
The combination of extended downside momentum and the proximity of macro support places SEI in a critical technical phase.
Extended sequences of weekly declines often indicate exhaustion phases within longer-term cycles. However, confirmation of a bottom typically requires either a strong reaction from support or a structural shift such as the formation of higher highs on the lower timeframes.
For now, the chart suggests that the asset remains inside its broader downtrend, with the lower boundary of the macro channel becoming the next key level that may determine whether the market stabilizes or continues its decline.
The post SEI Prints Nine Consecutive Red Weeks as Price Tests Macro Channel Support appeared first on ETHNews.


You May Also Like

Crypto Market Sees $114 Million in Futures Liquidated in One Hour as Leverage Unwinds

$280M drained via social engineering