

Index
Share
A crypto Index provides a way for investors to gain diversified exposure to a specific basket of digital assets through a single tokenized product. These indices often track specific sectors, such as DeFi, DePIN, or RWA, and are automatically rebalanced via smart contracts. In 2026, AI-managed thematic indices have become the gold standard for passive investing, allowing users to track the "blue chips" of the Web3 economy without manual portfolio management. This tag covers index methodology, rebalancing frequency, and the benefits of diversified crypto baskets.
24949 Articles
Created: 2026/02/02 18:52
Updated: 2026/02/02 18:52


Recommended by active authors

Latest Articles

UBS Considers Expanding Cryptocurrency Access for Individual Clients
2026/02/04 19:34

Top Dem rejects calls to abolish ICE but insists party will secure reform and control
2026/02/04 19:33
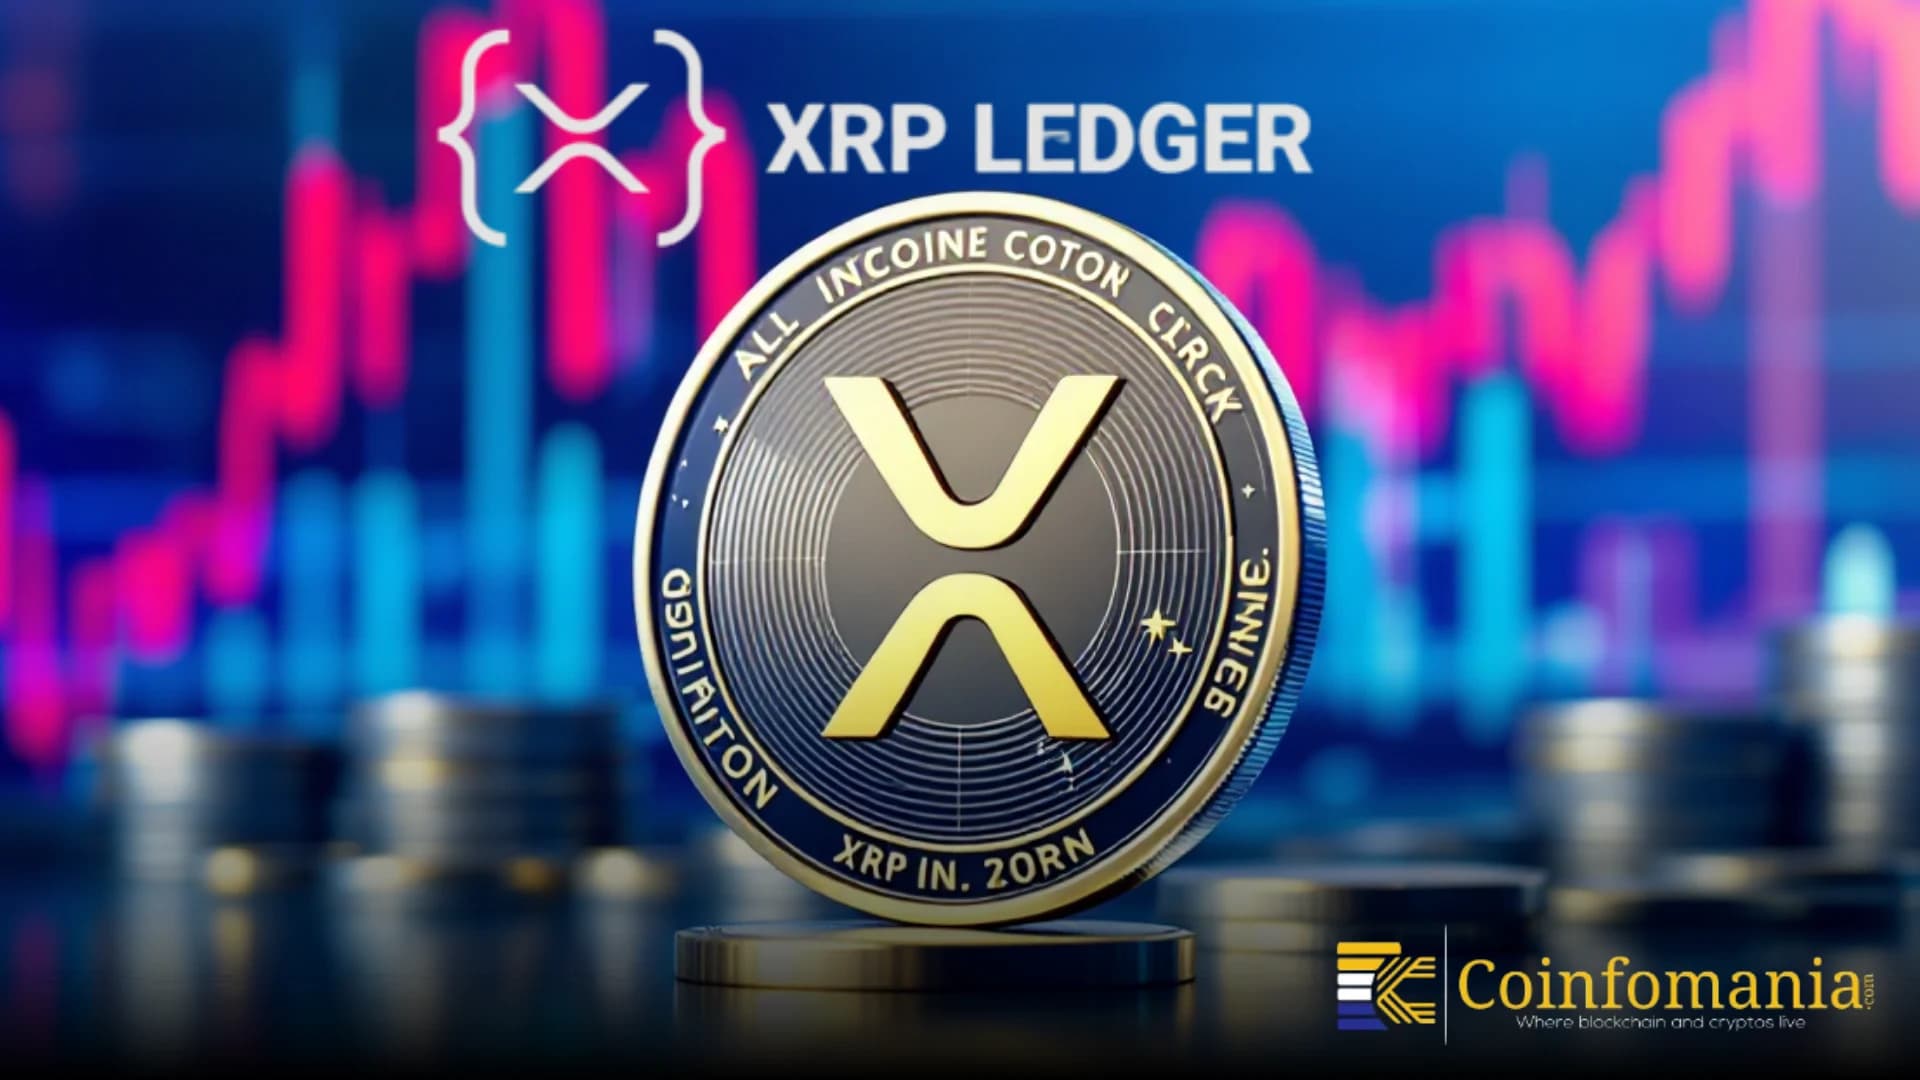
XRP Ledger Activates Permissioned Domains for Institutional Use
2026/02/04 19:27
Tesla Stock Forecast: Will $1.25T SpaceX-xAI Merge Boost TSLA?
2026/02/04 19:10

Tether fundraise scaled back as valuation doubts and timing concerns emerge
2026/02/04 18:31