The 3,800% AI Memory Legend Stalls: The Microstructure Behind SanDisk's 11% Flash Crash
The most spectacular equity performance in recent market history has officially slammed into a wall of institutional profit-taking. SanDisk Corp. (NASDAQ: SNDK), which captured global attention by skyrocketing over 3,780% since its February 2025 Nasdaq relisting (surging from a $40 base to an all-time high of $2,354.39), suffered a brutal intraday liquidation today, July 7, 2026. The stock gap-downed at the opening bell, gushing 11.18% to settle at $1,549.26 on heavy trading volume.
The abrupt double-digit plunge completely ignored a flurry of hyper-bullish Wall Street updates, including Bernstein raising its price objective to a street-high $3,000.00 and Bank of America backing a $2,500.00 target. Instead, SanDisk was caught in a systemic, sector-wide capital flight that spared no one in the hardware cluster, with Samsung triggering circuit breakers in Seoul and Micron tracking a parallel 22% bear-market retracement.
Macro & Market Microstructure Profile
| Market Identifier / Multiple | SanDisk Corp. (NASDAQ: SNDK) Operational Standing |
|---|---|
| Current Spot Price | $1,549.26 (Down 11.18% in the Tuesday session) |
| Market Capitalization | ~$227.8 Billion (Retaining its mega-cap boundary) |
| 52-Week Trading Range | $40.10 to $2,354.39 |
| Trailing P/E Multiple | 53.7x to 60.6x (Significant premium to industry median of 21.6x) |
| Next Systemic Catalyst | August 13, 2026 (Q4 FY26 Earnings Disclosures; Est. EPS: $33.38) |
The Catalysts: Why "Priced for Perfection" Broke on a Flawless Narrative
The core friction forcing the decline has nothing to do with SanDisk's current underlying ledger, which remains highly profitable. Instead, the drop is driven by technical exhaustion, insider defensive actions, and a fundamental shift in the macro AI narrative.
1. The Multi-File "AI Software Rotation"
For the past year, the macro AI trade was simple: buy physical hardware (GPUs and high-density enterprise NAND flash storage used to feed data lakes). However, institutional desks are shifting strategies. Driven by fears that enterprise hardware ordering by hyperscalers may sequentially cool by early 2027, capital is systematically rotating out of premium-valuation semiconductor names into lagging, lower-multiple AI software and enterprise application platforms. As one of the fastest-climbing assets on Wall Street, SanDisk was the first structural liquidity register that active managers chose to ring.
2. The Apple Supply Chain Leak
Sentiment was heavily undermined by supply chain checks indicating that anchor consumer tech platforms, reportedly led by Apple, have initiated early-stage procurement audits with lower-cost Chinese memory and flash memory consortiums for their late-2026 hardware stacks. While SanDisk's advanced corporate data center pipelines are protected under non-cancelable enterprise long-term agreements (LTAs), any threat of trailing-edge commodity price compression directly challenges the logic behind the stock's 60x trailing multiple.
3. Proactive Insider Liquidation
Traders noted that while investment banks spent late June upgrading price targets, SanDisk corporate insiders were doing the exact opposite. SEC registries reveal that corporate officers executed nearly $9 million in open-market share liquidations over the past 90 days. While minor relative to the market cap, this defensive insider cash-out served as an early warning sign that company management viewed the vertical chart geometry as temporarily over-extended.
Technical Trajectories: Tracking the Leverage Washout
For portfolios executing directional orders or options strategies on MEXC RealStocks, SanDisk's immediate path depends on absorbing an aggressive options gamma shift.
The Volatility Buffer Zone ($1,400 to $1,495)
Derivatives data reveals the expected weekly move options skew is clustering protection heavily near the $1,497 floor. If institutional long-only funds step in to absorb the supply within this range over the consecutive sessions, the stock will establish a highly necessary consolidation box to digest its massive 2026 gains.
The Valuation Reset Zone (Breakdown below $1,400)
If broader tech sector liquidations persist, breaking the $1,400 structural boundary exposes a clean technical path toward filling legacy chart gaps down near the $1,250.00 horizon (aligning with Wells Fargo's conservative baseline model).
What High-Growth Traders Usually Miss
The LTA Revenue Insulation Trap: The bullish case for SanDisk relies on its long-term supply agreements (LTAs), which lower the risk compared with past brutal storage cycles. However, these contracts function as a double-edged sword: while they guarantee an insulated revenue floor during macro downturns, they also feature strict upside caps that prevent SanDisk from capturing additional windfalls during acute spot-market supply crunches.
The High-Volatility Leverage Stampede: Because SanDisk's rapid ascension made it a core component of momentum-chasing quantitative algorithms, today's 11% drop was amplified by systematic delta-hedging. As the price broke below short-term moving averages, market makers were forced to automatically dump large underlying blocks of equity to balance their options exposure, exacerbating the technical drop.
Bottom Line
This looks like a mandatory technical correction and a massive leverage clean-out rather than a permanent destruction of SanDisk's storage monopoly. The business is fundamentally robust, but the stock was simply priced for absolute perfection. Attempting to aggressively leverage long positions immediately following a violent 11% structural liquidation carries significant near-term friction. Allowing the technical indicators to mean-revert and wait for a verified accumulation floor near the $1,400 support horizon offers a vastly cleaner risk-to-reward matrix before building positions ahead of the August 13 earnings print.
Risk Warning
Trading highly extended, newly listed or relisted mega-cap technology equities involves severe capital exposure, extreme options-driven volatility, and sharp margin liquidation risks. Flash memory and hardware assets remain highly sensitive to macro sector rotations, customer supply-chain diversifications, and institutional programmatic selling. Strict stop-losses and unleveraged capital distribution strategies are strongly recommended.
บทความยอดนิยม
ดูเพิ่มเติม
อะไรขับเคลื่อนราคา LITEON? ศูนย์ข้อมูล AI, เครือข่ายออปติคอล และหุ้น Lumentum อธิบายแล้ว
สรุป ราคาของ LITEON เชื่อมโยงโดยพื้นฐานกับหุ้นของ Lumentum Holdings ซึ่งก็คือ LITE นั่นหมายความว่าวิธีที่มีประโยชน์ที่สุดในการวิเคราะห์ LITEON ไม่ใช่ผ่านโทเคนโนมิกส์ของคริปโตแบบทั่วไป แต่ผ่านห่วงโซ่เศ

คำอธิบายความร่วมมือระหว่าง Lumentum และ NVIDIA: ออปติก AI การลงทุน 2 พันล้านดอลลาร์ และความหมายต่อ LITEON
สรุป NVIDIA และ Lumentum ประกาศข้อตกลงเชิงกลยุทธ์ระยะยาวหลายปีเมื่อวันที่ 2 มีนาคม 2026 โดยมุ่งเน้นไปที่เทคโนโลยีออปติคัลขั้นสูงสำหรับโครงสร้างพื้นฐาน AI รุ่นถัดไป ข้อตกลงนี้รวมถึง: การลงทุน 2 พันล้าน

อธิบายความเสี่ยงของ LITEON: AI CapEx, การประเมินมูลค่า, ความเสี่ยงจากการกระจุกตัวของลูกค้า และความเสี่ยงด้านเทคโนโลยีออปติคัล
สรุป LITEON รวมความเสี่ยงด้านสินทรัพย์สุทธิพื้นฐานของ Lumentum เข้ากับชั้นตลาดแบบโทเค็นเพิ่มเติม ความเสี่ยงระดับบริษัทที่ใหญ่ที่สุด ได้แก่: การชะลอตัวของรายจ่ายด้าน AI; ความคาดหวังการเติบโตที่สูงมาก;

ข่าวที่กำลังมาแรง
ดูเพิ่มเติม
รายงานประจำวัน On-chain ของ MEXC: Revolut เตรียมถอด USDT ออกจากกระดานภายในสิ้นเดือนสิงหาคม เนื่องจากมาตรการปฏิบัติตามกฎระเบียบในยุโรปเข้มงวดขึ้น
ตลาดคริปโตยังคงพัฒนาไปพร้อมกับการเปลี่ยนแปลงด้านกฎระเบียบ การขยายโครงสร้างพื้นฐานด้าน AI และการมีส่วนร่วมของสถาบันที่เพิ่มขึ้น สหราชอาณาจักรได้เปิดเผยกรอบกฎระเบียบใหม่สำหรับคริปโต การชำระเงินข้ามพรมแด
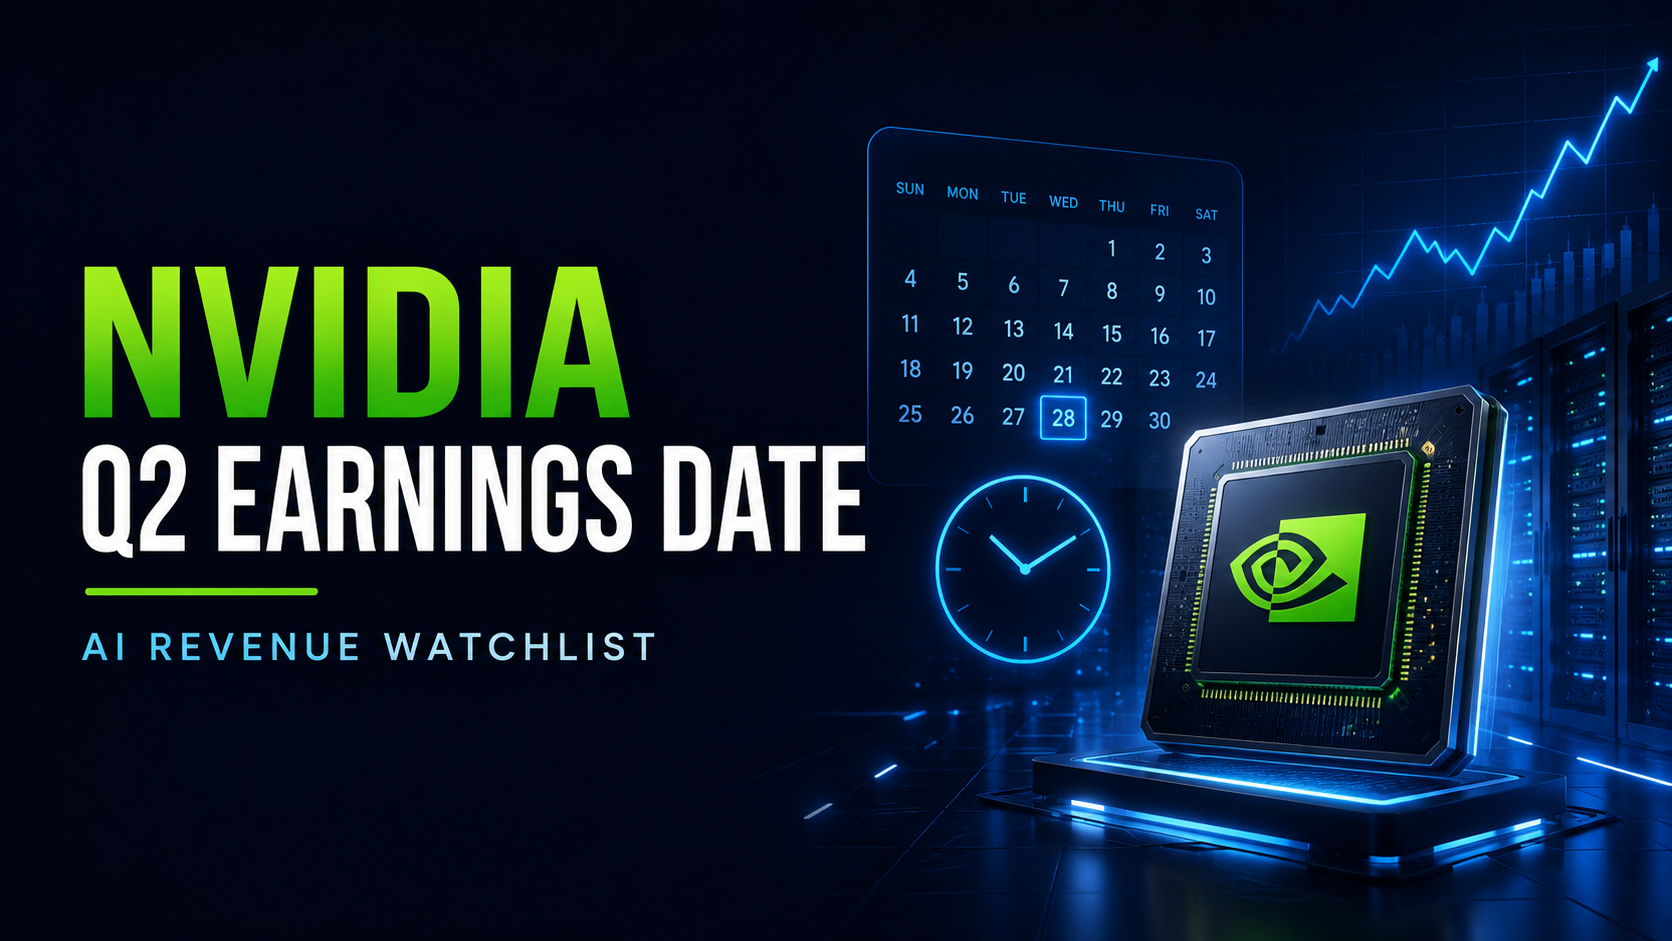
วันที่ประกาศผลประกอบการของ Nvidia ไตรมาส 2 ปีงบประมาณ 2027: เวลาที่คาดว่าจะรายงาน การประชุมสรุปผลประกอบการ และรายการติดตามรายได้จาก AI
ผลประกอบการไตรมาส 2 ปีงบประมาณ 2027 ของ Nvidia คาดว่าจะกลายเป็นหนึ่งในเหตุการณ์สำคัญที่สุดของตลาด AI ในช่วงฤดูร้อน Wall Street Horizon ระบุวันประกาศผลประกอบการครั้งต่อไปของ Nvidia คือวันพุธที่ 26 สิงห
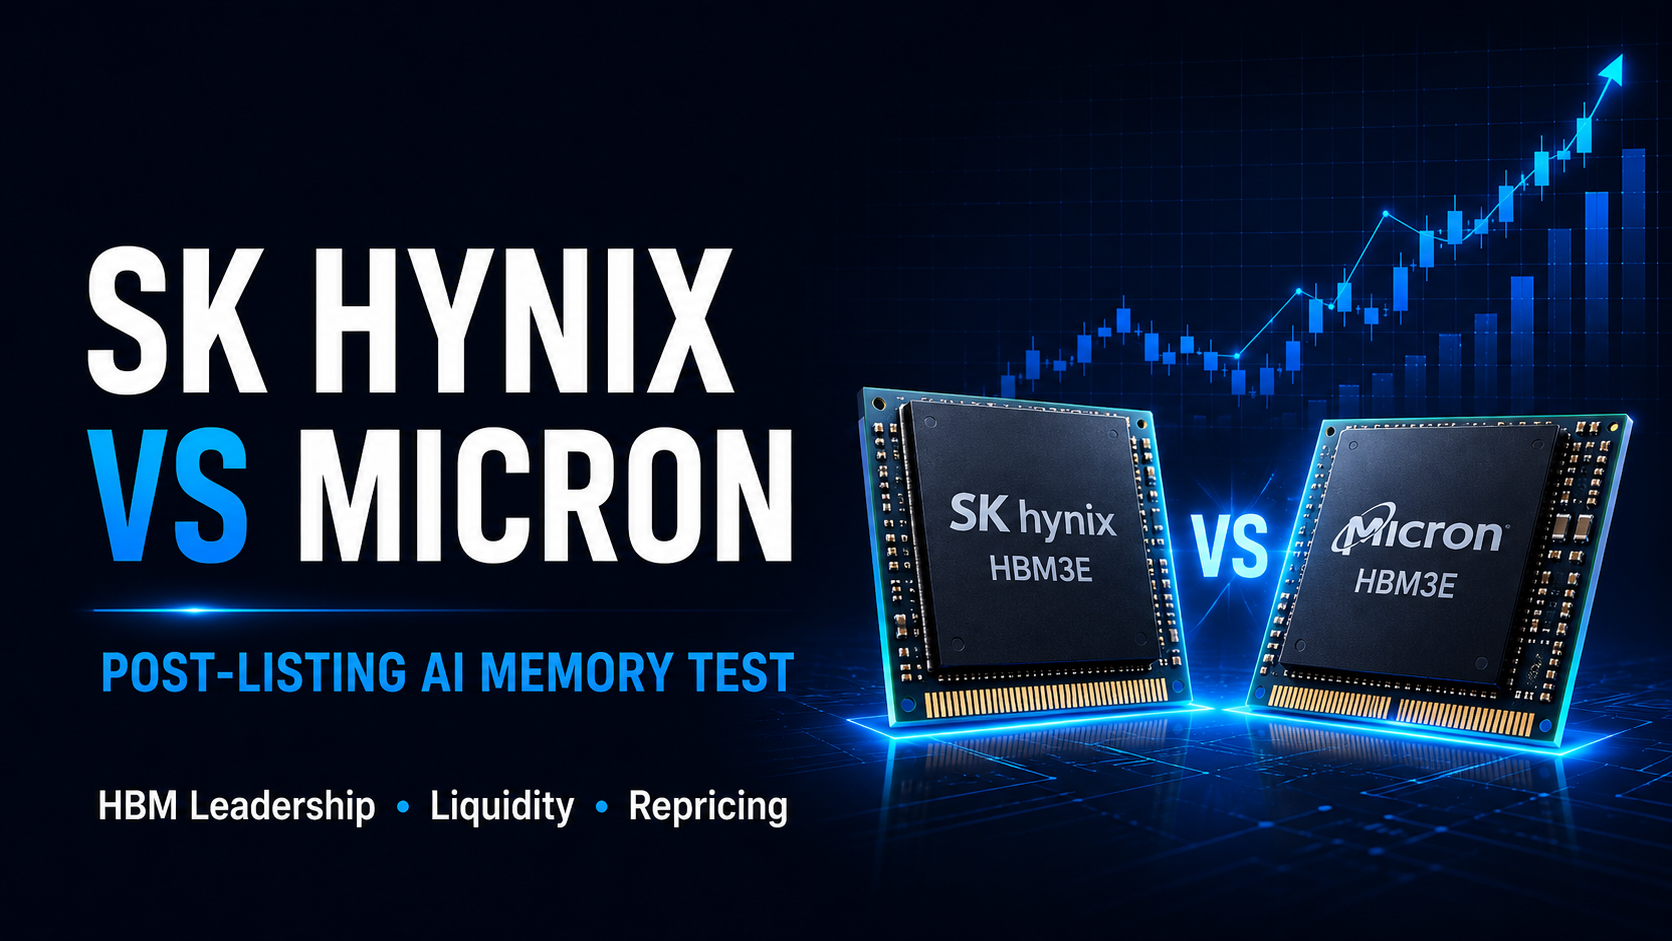
SK Hynix เทียบกับ Micron: การเข้าจดทะเบียน SKHY ที่กำลังจะเกิดขึ้นปรับราคาใหม่ของความเป็นผู้นำด้านหน่วยความจำ AI และ HBM อย่างไร
การเปิดตัวในตลาด Nasdaq ที่เป็นที่จับตามองอย่างมากของ SK Hynix ภายใต้สัญลักษณ์หุ้น SKHY พร้อมที่จะเปลี่ยนแปลงวิธีที่นักลงทุนสหรัฐฯ ประเมินหุ้นหน่วยความจำสำหรับ AI มาหลายปีแล้วที่ Micron (MU) ทำหน้าที่

รายงานประจำวันบนเชนของ MEXC: ปริมาณการซื้อขาย DEX รายวันบน Robinhood Chain สูงเกิน 560 ล้านดอลลาร์สหรัฐ
ระบบนิเวศของ Robinhood Chain เติบโตอย่างแข็งแกร่ง เนื่องจากปริมาณการซื้อขาย DEX รายวันเกิน 560 ล้านดอลลาร์สหรัฐ ขณะที่การนำไปใช้โดยสถาบันของ DeFi และโครงสร้างพื้นฐานข้ามเชนเร่งตัวขึ้น ในขณะเดียวกัน ผู
บทความที่เกี่ยวข้อง
ดูเพิ่มเติม
การคาดการณ์ USDJPY หลังการพุ่งขึ้นของเงินเยนวันที่ 30 ก.ค. 2026: ทำไมดอลลาร์จึงร่วงลง และอะไรจะเกิดขึ้นต่อไป
USDJPY เกิดการกลับทิศทางอย่างรุนแรงผิดปกติในช่วงค่ำของวันที่ 30 ก.ค. 2026 ตามเวลา ฮ่องกง ดอลลาร์สหรัฐร่วงลงมากถึง 3% เมื่อเทียบกับเงินเยนญี่ปุ่น ส่งผลให้ USDJPY ลดลงชั่วคราวมาอยู่ราว 158.34 หลังจากที่

กระแสการไหลของสินทรัพย์อัจฉริยะคริปโตสู่ MEXC: กระแสเงินไหลเข้าสุทธิใน 24 ชั่วโมงและ 7 วันเผยอะไรบ้าง
สรุปในตลาดคริปโต เงินทุนมักจะเคลื่อนไปยังแพลตฟอร์มที่มีสภาพคล่องที่แข่งขันได้ ครอบคลุมสินทรัพย์อย่างกว้างขวาง โครงสร้างพื้นฐานการเทรดที่มีประสิทธิภาพ และข้อมูลเงินสำรองที่โปร่งใส ในบทความนี้ คำว่า สิน

ทำไมคริปโตถึงตก? ไม่ใช่ FUD แต่เป็นการหมุนเวียนไปสู่สินทรัพย์แข็ง & ช่องว่างสภาพคล่องก่อนตรุษจีน
หากคุณกำลังมองหาพาดหัวข่าวที่เฉพาะเจาะจงเพื่ออธิบายแท่งเทียนสีแดงของวันนี้ หยุดมองหาเถอะ ไม่มีข่าวนั้นเทรดเดอร์รายย่อยกำลังค้นหา "FUD" (ความกลัว ความไม่แน่นอน ความสงสัย) บน Twitter เพื่อโทษสำหรับการตร