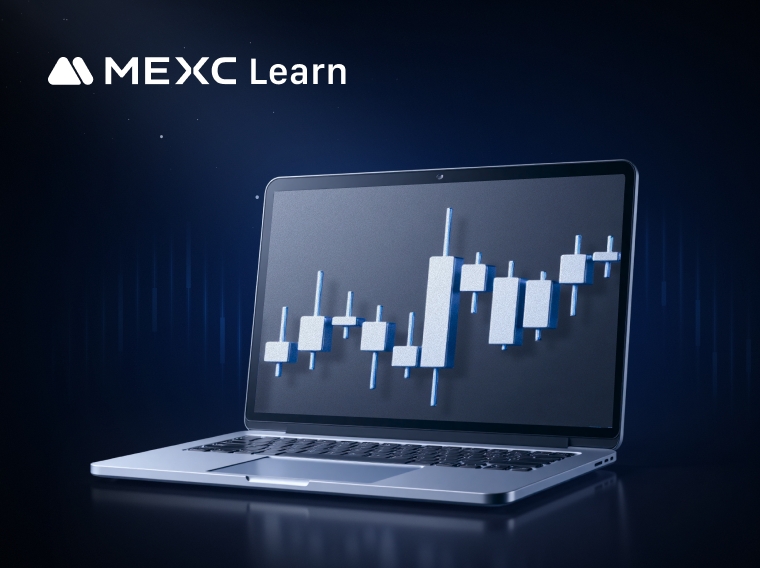
The Ichimoku Cloud Chart is a technical analysis method that combines multiple technical indicators into one chart. It can display potential support and resistance areas, trend direction, andThe Ichimoku Cloud Chart is a technical analysis method that combines multiple technical indicators into one chart. It can display potential support and resistance areas, trend direction, and
เรียนรู้/Trading Guide/Technical Indicators/What is an ...loud Chart?

What is an Ichimoku Cloud Chart?

Sep 21, 2026MEXC
0m
Lagrange
LA$0.07473+0.91%
The Ichimoku Cloud Chart is a technical analysis method that combines multiple technical indicators into one chart. It can display potential support and resistance areas, trend direction, and provides clear price behavior analysis, helping traders find the best entry and exit points.

The Ichimoku Cloud Chart was proposed by Japanese journalist Goichi Hosoda in the 1930s. After years of research and improvement in this analytical technique, it was eventually shared publicly in the 1960s, becoming a well-known indicator widely used in technical analysis today.

In MEXC's futures trading, the Ichimoku Cloud analysis indicator has been introduced. You can add this indicator to the basic K-Line chart and use it to support your daily futures trading.

1. Ichimoku Cloud Composition


The Ichimoku Cloud consists of five parts: the Conversion Line, Base Line, Lagging Span, Leading Span A, and Leading Span B.

1.1 Conversion Line: This is a 9-day moving average line. Calculation method: Conversion Line = (Highest high in 9 days + Lowest low in 9 days) / 2. It is represented by the blue line in the diagram below.

1.2 Base Line (Kijun-sen): This is a 26-day moving average line. Calculation method: Base Line = (Highest high in 26 days + Lowest low in 26 days) / 2. It is represented by the brown line in the diagram below.

1.3 Lagging Span (Chikou Span): The Lagging Span shows the current day's closing price compared to the average of the past 26 days, represented by the deep green line in the diagram below.

1.4 Leading Span A (Senkou Span A): This predicts the future trend within the next 26 days through the moving average of the Conversion Line and Base Line. Calculation method: Leading Span A = (Conversion Line + Base Line) / 2. It is represented by the light green line in the diagram below.

1.5 Leading Span B (Senkou Span B): This predicts the future trend within the next 26 days through the 52-day moving average. Calculation method: Leading Span B = (Highest high in 52 days + Lowest low in 52 days) / 2. It is represented by the pink line in the diagram below.

1.6 Cloud: The area between Leading Span A and Leading Span B.


2. Ichimoku Cloud Uses


2.1 Determining Future Trend Direction


As seen in the chart, the cloud spans the last 26 periods of the K-Line chart.

When Senkou Span A is higher than Senkou Span B, creating a green cloud, it signals a bullish trend. Conversely, a red cloud formation indicates a bearish trend. Transitioning from a red cloud to a green cloud signals a bullish trend, while shifting from a green cloud to a red cloud indicates a bearish trend.

When the market price is above the cloud, it signals a bullish trend, and when it is below the cloud, it signals a bearish trend.

2.2 Generating Trading Signals


During an uptrend, a buy signal occurs when the token price crosses above the baseline while being above the cloud. Conversely, in a downtrend, a sell signal is triggered when the token price crosses below the baseline while being below the cloud.

Similarly, in an uptrend, a buy signal is generated when the conversion line crosses above the baseline while the price remains above the cloud. Conversely, during a downtrend, a sell signal is indicated when the conversion line crosses below the baseline while the price is below the cloud.

2.3 Forming Resistance and Support Levels


The Senkou Span A and Senkou Span B on both sides of the cloud form resistance and support levels in token price fluctuations, crucially providing traders with projected support/resistance areas for the next 26 days. The wider the cloud appears on the chart, the lower the likelihood of a trend reversal.

3. How to Use Ichimoku Cloud on MEXC


Currently, you can open and use Ichimoku Cloud on the web version, but it is not yet supported on the app version.

3.1 How to Open Ichimoku Cloud


Open the MEXC official website and log in. Choose [USDT-M Perpetual Futures] under [Futures] to access the futures trading page. (Note: The process is identical for Coin-M Perpetual Futures.)

On the futures trading page, click on the indicators button, check [ICHIMOKU Cloud], and click [Confirm] to open the Ichimoku Cloud data indicator.


3.2 How to Set Up Ichimoku Cloud


After opening the Ichimoku Cloud, you will see the relevant data included in the indicator above the K-line chart. These data show the information corresponding to the current position of your cursor, as well as the color of the corresponding line segment on the chart.

Click the [X] button to close the Ichimoku Cloud.


Click on the settings button to modify the basic parameter data of the Ichimoku Cloud. It also supports customizing the line style, including line color, thickness, and more, to better align with your personal preferences.


The Ichimoku Cloud provides us with an opportunity to gain insights into market trends. You can combine it with other indicators to develop your own trading strategy. As no indicator is foolproof, you can enhance your market analysis by using a combination of different indicators. Also, in futures trading, it is recommended to set SL orders when opening positions to avoid excessive losses due to strategy errors.

Disclaimer: This information does not provide advice on investment, taxation, legal, financial, accounting, consultation, or any other related services, nor does it constitute advice to purchase, sell, or hold any assets. MEXC Learn provides information for reference purposes only and does not constitute investment advice. Please ensure you fully understand the risks involved and exercise caution when investing. The platform is not responsible for users' investment decisions.


โอกาสทางการตลาด
Lagrange โลโก้
ราคา Lagrange(LA)
$0.07473
$0.07473$0.07473
+1.04%
USD
Lagrange (LA) กราฟราคาสด

บทความยอดนิยม

ดูเพิ่มเติม
CPI พุ่งขึ้น กระตุ้นความกังวลเรื่องการขึ้นดอกเบี้ย; อัตราผลตอบแทนพันธบัตรรัฐบาลสหรัฐฯ ทะลุ 5% สู่ระดับสูงสุดในรอบ 19 ปี: ตลาดกำลังตั้งราคาอะไรไว้? | MEXC Alpha Trader Research รายสัปดาห์

CPI พุ่งขึ้น กระตุ้นความกังวลเรื่องการขึ้นดอกเบี้ย; อัตราผลตอบแทนพันธบัตรรัฐบาลสหรัฐฯ ทะลุ 5% สู่ระดับสูงสุดในรอบ 19 ปี: ตลาดกำลังตั้งราคาอะไรไว้? | MEXC Alpha Trader Research รายสัปดาห์

กันยายน 2026, สัปดาห์ที่ 2 รอบระยะเวลารายงาน: 9 กันยายน – 15 กันยายน 2026 จุดตัดข้อมูล: 15 กันยายน 2026 ภาพรวมตลาด สัปดาห์ที่ผ่านมา ตลาดคริปโตเผชิญแรงกดดันอย่างต่อเนื่องจากปัจจัยลบหลายประการที่รวมกัน

MEXC Alpha Trader Research Weekly | ความแตกต่างที่หายากระหว่าง NFP-ADP กระตุ้นการชิงชัยในตลาด: ขึ้นอัตราดอกเบี้ยหรือหยุดชั่วคราว?

MEXC Alpha Trader Research Weekly | ความแตกต่างที่หายากระหว่าง NFP-ADP กระตุ้นการชิงชัยในตลาด: ขึ้นอัตราดอกเบี้ยหรือหยุดชั่วคราว?

สัปดาห์แรกของเดือนกันยายน 2026 ช่วงเวลาทางสถิติ: 2 ก.ย. 2026 – 8 ก.ย. จุดตัดข้อมูล: 8 ก.ย. 2026 แก่นเรื่องหลัก จากข้อมูลเศรษฐกิจมหภาคและความตึงเครียดทางภูมิรัฐศาสตร์ ตลาดคริปโตประสบกับความผันผวนอย่างม
ค่าธรรมเนียมการเทรดและอัตราการระดมทุนของ MEXC อธิบาย: คู่มือล่าสุดเกี่ยวกับอัตราสปอตและฟิวเจอร์ส

ค่าธรรมเนียมการเทรดและอัตราการระดมทุนของ MEXC อธิบาย: คู่มือล่าสุดเกี่ยวกับอัตราสปอตและฟิวเจอร์ส

ไม่ว่าคุณจะเป็นผู้เทรดสกุลเงินดิจิทัลที่มีประสบการณ์หรือเพิ่งเริ่มต้น การทำความเข้าใจค่าธรรมเนียมการเทรดถือเป็นสิ่งสำคัญในการนำทางตลาดและปรับปรุงประสบการณ์การเทรดของคุณ MEXC ซึ่งเป็นศูนย์แลกเปลี่ยนสกุ

MEXC Alpha Trader รายงานวิจัยรายสัปดาห์ | คำกล่าวเชิงเข้มงวดจากวอชิงตันปรับเปลี่ยนความคาดหวัง: โอกาสขึ้นอัตราดอกเบี้ยพุ่งเป็น 56% กดดันสินทรัพย์เสี่ยง

MEXC Alpha Trader รายงานวิจัยรายสัปดาห์ | คำกล่าวเชิงเข้มงวดจากวอชิงตันปรับเปลี่ยนความคาดหวัง: โอกาสขึ้นอัตราดอกเบี้ยพุ่งเป็น 56% กดดันสินทรัพย์เสี่ยง

สัปดาห์ที่ 4 ของเดือนสิงหาคม 2026 ช่วงเวลา: 26 ส.ค. 2026 – 1 ก.ย. 2026 วันตัดข้อมูล: 1 ก.ย. 2026 ประเด็นหลัก ตลอดสัปดาห์ที่ผ่านมา ตลาดคริปโตเกิดการกลับทิศอย่างรุนแรง เปลี่ยนอย่างรวดเร็วจากความคลั่งไคล

ข่าวที่กำลังมาแรง

ดูเพิ่มเติม
ไทยยกเว้นภาษีกำไรคริปโตถึงปี 2029 เฉพาะธุรกรรมผ่านผู้ประกอบการมีใบอนุญาต

ไทยยกเว้นภาษีกำไรคริปโตถึงปี 2029 เฉพาะธุรกรรมผ่านผู้ประกอบการมีใบอนุญาต

ไทยยกเว้นภาษีเงินได้บุคคลธรรมดาสำหรับกำไรคริปโตที่เข้าเงื่อนไขถึงสิ้นปี 2029 โดยธุรกรรมต้องผ่านผู้ประกอบการสินทรัพย์ดิจิทัลที่มีใบอนุญาต

ก.ล.ต. ไทยเสนอเปิดทางธุรกิจสินทรัพย์ดิจิทัลขอใบอนุญาตอนุพันธ์ผ่านนิติบุคคลเดิม

ก.ล.ต. ไทยเสนอเปิดทางธุรกิจสินทรัพย์ดิจิทัลขอใบอนุญาตอนุพันธ์ผ่านนิติบุคคลเดิม

ก.ล.ต. ไทยเสนอให้ธุรกิจสินทรัพย์ดิจิทัลที่เข้าเกณฑ์ขอใบอนุญาตอนุพันธ์ผ่านนิติบุคคลเดิม พร้อมมาตรการจัดการผลประโยชน์ทับซ้อน


ครม.ไทยเห็นชอบหลักการขยายกรอบอนุพันธ์ให้ครอบคลุมสินทรัพย์ดิจิทัล

ครม.ไทยเห็นชอบหลักการขยายกรอบอนุพันธ์ให้ครอบคลุมสินทรัพย์ดิจิทัล

ครม.ไทยเห็นชอบในหลักการให้ขยายกรอบอนุพันธ์สู่สินทรัพย์ดิจิทัลและคาร์บอนเครดิต ขณะที่ ก.ล.ต. ยังต้องจัดทำกฎ ใบอนุญาต และข้อกำหนดผลิตภัณฑ์

ไทยยกเว้นภาษีเงินได้จากกำไรคริปโทถึงปี 2029 ภายใต้เงื่อนไขผู้ให้บริการมีใบอนุญาต

ไทยยกเว้นภาษีเงินได้จากกำไรคริปโทถึงปี 2029 ภายใต้เงื่อนไขผู้ให้บริการมีใบอนุญาต

ไทยยกเว้นภาษีเงินได้บุคคลธรรมดาสำหรับกำไรคริปโทที่เข้าเกณฑ์ในปี 2025–2029 โดยต้องทำธุรกรรมผ่านผู้ประกอบธุรกิจสินทรัพย์ดิจิทัลที่มีใบอนุญาต

บทความที่เกี่ยวข้อง

ดูเพิ่มเติม
เรียนรู้ถึง: เชี่ยวชาญแนวโน้มตลาดด้วยตัวบ่งชี้การเทรดคริปโต: คู่มือฉบับสมบูรณ์

เรียนรู้ถึง: เชี่ยวชาญแนวโน้มตลาดด้วยตัวบ่งชี้การเทรดคริปโต: คู่มือฉบับสมบูรณ์

ในการเทรดสกุลเงินดิจิทัล การวิเคราะห์ตัวบ่งชี้ทางเทคนิคหมายถึงวิธีเชิงปริมาณที่ใช้สูตรทางคณิตศาสตร์และสถิติเพื่อประเมินแนวโน้มของตลาด การประมวลผลข้อมูลราคาและปริมาณผ่านการคำนวณเฉพาะ ช่วยให้ผู้ลงทุนได้

CPI พุ่งขึ้น กระตุ้นความกังวลเรื่องการขึ้นดอกเบี้ย; อัตราผลตอบแทนพันธบัตรรัฐบาลสหรัฐฯ ทะลุ 5% สู่ระดับสูงสุดในรอบ 19 ปี: ตลาดกำลังตั้งราคาอะไรไว้? | MEXC Alpha Trader Research รายสัปดาห์

CPI พุ่งขึ้น กระตุ้นความกังวลเรื่องการขึ้นดอกเบี้ย; อัตราผลตอบแทนพันธบัตรรัฐบาลสหรัฐฯ ทะลุ 5% สู่ระดับสูงสุดในรอบ 19 ปี: ตลาดกำลังตั้งราคาอะไรไว้? | MEXC Alpha Trader Research รายสัปดาห์

กันยายน 2026, สัปดาห์ที่ 2รอบระยะเวลารายงาน: 9 กันยายน – 15 กันยายน 2026จุดตัดข้อมูล: 15 กันยายน 2026ภาพรวมตลาดสัปดาห์ที่ผ่านมา ตลาดคริปโตเผชิญแรงกดดันอย่างต่อเนื่องจากปัจจัยลบหลายประการที่รวมกัน ได้แ

อะไรขับเคลื่อนราคา LITEON? ศูนย์ข้อมูล AI, เครือข่ายออปติคอล และหุ้น Lumentum อธิบายแล้ว

อะไรขับเคลื่อนราคา LITEON? ศูนย์ข้อมูล AI, เครือข่ายออปติคอล และหุ้น Lumentum อธิบายแล้ว

สรุปราคาของ LITEON เชื่อมโยงโดยพื้นฐานกับหุ้นของ Lumentum Holdings ซึ่งก็คือ LITEนั่นหมายความว่าวิธีที่มีประโยชน์ที่สุดในการวิเคราะห์ LITEON ไม่ใช่ผ่านโทเคนโนมิกส์ของคริปโตแบบทั่วไป แต่ผ่านห่วงโซ่เศรษ

คำอธิบายความร่วมมือระหว่าง Lumentum และ NVIDIA: ออปติก AI การลงทุน 2 พันล้านดอลลาร์ และความหมายต่อ LITEON

คำอธิบายความร่วมมือระหว่าง Lumentum และ NVIDIA: ออปติก AI การลงทุน 2 พันล้านดอลลาร์ และความหมายต่อ LITEON

สรุปNVIDIA และ Lumentum ประกาศข้อตกลงเชิงกลยุทธ์ระยะยาวหลายปีเมื่อวันที่ 2 มีนาคม 2026 โดยมุ่งเน้นไปที่เทคโนโลยีออปติคัลขั้นสูงสำหรับโครงสร้างพื้นฐาน AI รุ่นถัดไปข้อตกลงนี้รวมถึง:การลงทุน 2 พันล้านดอล


ลงทะเบียนบน MEXC
ลงทะเบียนและรับโบนัสสูงถึง 10,000 USDT
คุณมีดีเอ็นเอนวอลล์สตรีทแค่ไหน?
คุณมีดีเอ็นเอนวอลล์สตรีทแค่ไหน?คุณมีดีเอ็นเอนวอลล์สตรีทแค่ไหน?
6 โปรไฟล์ ทุกคนได้ส่วนแบ่งรางวัล $30K ใน NVDAX

ฮอต

สกุลเงินดิจิทัลที่กำลังเป็นกระแสในปัจจุบันซึ่งได้รับความสนใจจากตลาดอย่างมาก

วอลุ่มสูงสุด

สกุลเงินดิจิทัลที่มีปริมาณการซื้อขายสูงสุด

เพิ่มใหม่

รายชื่อสกุลเงินดิจิทัลล่าสุดที่สามารถซื้อขายได้