Solana Faces Bearish Pressure as TD Sequential Points to Possible $90 Drop
Solana trades near $95.45 as TD Sequential flashes a sell signal, with $90 support in focus below the key $113 resistance level.
Solana is facing fresh selling pressure after the TD Sequential indicator flashed a sell signal on the daily chart.
The signal has raised attention around a possible move toward $90, as SOL trades near $95.45 and remains below a key Fibonacci support zone.
TD Sequential Signal Points to Weakness
Solana’s daily chart shows a TD Sequential sell signal, which often marks a possible pause or pullback. The signal comes after SOL recovered from lower levels but failed to reclaim major resistance.
Market analysts are now focused on the $90 area. This level sits close to the current price and may act as the next short-term support zone.
SOL is trading around $95.45 at the time of the chart reading. The token is also below the Fibonacci range drawn between about $113 and $235.
The $113.03 level had served as structural support during earlier trading. Its breakdown changed the short-term setup and placed SOL under bearish pressure.
Solana Remains Below Major Fibonacci Levels
The loss of the $113 level is a key technical event for Solana. Price is now trading below the main retracement area, which weakens the earlier bullish structure.
The nearest resistance stands near $113. A daily close above this level would be the first sign of a stronger recovery attempt.
If SOL moves above $113, the next resistance levels are $139.20 and $159.75. These zones match the 0.786 and 0.618 Fibonacci levels.
Further resistance is seen at $174.18, $188.61, and $206.47. The upper range near $235.33 remains a major barrier for buyers.
On the downside, SOL is trading inside a broad support area between $80 and $95. Buyers have defended this zone in past sessions.
A move below the low-$80 area could add more selling pressure. It may also open the way for a deeper correction.
Read Also:
RSI and MACD Show Mixed Momentum
The RSI 14 is near 67, while its average is close to 57. This shows that short-term momentum has improved.
However, the RSI is also moving near the upper part of its range. A move above 70 could show strong buying pressure, but it may also bring caution.
The MACD is also turning positive on the daily chart. The MACD line is above the signal line, and the histogram is slightly positive.
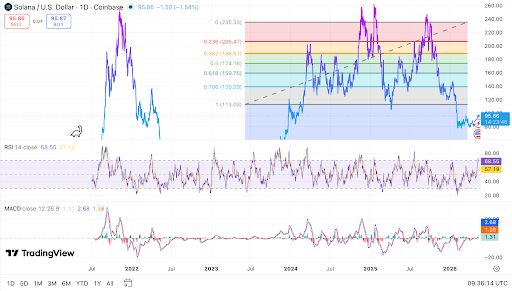 SOL trades near $95.86 below key resistance, chart shows. Source: TradingView.
This setup shows that buyers have gained some short-term control. Even so, the move remains early and does not confirm a full trend change.
For bulls, the main task is a close above $113. Without that move, rallies may still face selling near resistance.
For bears, failure below $113 keeps attention on $90, then the $85 to $80 support zone. A break below that area would weaken the chart further.
Solana’s chart shows a split setup. Momentum has improved, but price remains below a major broken support.
The TD Sequential sell signal adds pressure, and traders are watching whether SOL can defend the $90 area.
The post Solana Faces Bearish Pressure as TD Sequential Points to Possible $90 Drop appeared first on Live Bitcoin News.


Ayrıca Şunları da Beğenebilirsiniz

GDP growth may slow further as price pressures mount

The economic significance of Filipino seafarers: challenges